
Growth and Yield Response of Pea (Pisum sativum L.) Cultivars to Phosphorus Fertilization


Research Article
Growth and Yield Response of Pea (Pisum sativum L.) Cultivars to Phosphorus Fertilization
Sana Khan1*, Faiza Aman1, Muhammad Ismaeel2, Zafar Ali2, Mehboob Alam1, Sadeed Iqbal1 and Taimur Khan3
1Department of Horticulture, Faculty of Crop Production Sciences, The University of Agriculture, Peshawar, Khyber Pakhtunkhwa, Pakistan; 2Agricultural Research Station Swabi, Department of Agricultural Research, The University of Agriculture, Khyber Pakhtunkhwa, Peshawar, Pakistan; 3Department of Entomology, Faculty of Crop Protection Sciences, The University of Agriculture, Peshawar, Khyber Pakhtunkhwa, Pakistan.
Abstract | An experiment was carried out to evaluate the effect of varying levels of phosphorus on growth and yield parameters of pea (Pisum sativum L.) cultivars at Agricultural Research Station, Swabi-Pakistan, during the year 2016-17. The plots were prepared according to Randomized Complete Block Design (RCBD) with split plot arrangement that were replicated three times. Phosphorus levels (0, 30. 60, 90, and 120 kg ha-1) were subjected to main plots and cultivars (Meteor, Samrina Zard, Leena Pak and Pea-2009) to sub plots. Data was collected on growth and yield parameters of randomly selected plants in each treatment and replication. Results showed that phosphorus levels significantly affected all growth parameters. Maximum absolute growth rate (3.31cm day-1), leaflets plant-1 (102.61), pods plant-1 (16.43), pod length (9.53 cm), root weight (4.67 g), nodules plant-1 (19.97), 100 seeds weight (40.66 g) and yield ha-1 (5.71 tons) were recorded in plants treated with 90 kg ha-1 of phosphorus. The results pertaining to cultivars revealed that maximum absolute growth rate (2.81 cm day-1), leaflets plant-1 (100.87), 100 seeds weight (39.73 g), pods plant-1 (17.06), root weight (5.90 g), number of nodules plant-1 (18.66) and yield ha-1 (5.92 tons) were recorded in Leena Pak cultivar. The cultivar Leena Pak was found higher yielding as compared to other cultivars under this study. It can be concluded from the research findings that cultivar Leena Pak should be fertilized with 90 kg ha-1 of phosphorus for better performance in terms of growth and yield under the agro-climatic conditions of Swabi District-Pakistan.
Received | February 07, 2018; Accepted | January 05, 2021; Published | April 04, 2021
*Correspondence | Sana Khan, Department of Horticulture, Faculty of Crop Production Sciences, The University of Agriculture, Peshawar, Khyber Pakhtunkhwa, Pakistan; Email: sannokhan5@gmail.com
Citation | Khan, S., F. Aman, M, Ismaeel, Z. Ali, M. Alam, S. Iqbal and T. Khan. 2021. Growth and yield response of pea (Pisum sativum L.) cultivars to phosphorus fertilization. Sarhad Journal of Agriculture, 37(2): 369-376.
DOI | https://dx.doi.org/10.17582/journal.sja/2021/37.2.369.376
Keywords | Growth, Yield, Phosphorous, Cultivars, Agro climatic conditions
Introduction
Pea (Pisum sativum L.) is a cool season vegetable belonging to leguminosea family and native to central or Southeast Asia. It is one of the most important and popular legume vegetables grown in many countries all over the world. It consists of high nutritive components like protein, carbohydrates, iron, calcium and vitamins (Khichi et al., 2016). It contains high amount of stored reserves that protract early germination and growth of seedling. Root of pea plant is tap root and is capable of fixing nitrogen through their symbiotic relationship with rhizobium bacteria. Pea crop produces an average yield of 105 tons ha-1 in the country (Khokhar, 2014). The factors such as crop growth rate, market class, early maturity, harvest ease, yield potential, seed size and disease tolerance should be considered for the selection of appropriate pea cultivar. The cultivated pea varieties in Pakistan are mostly low in yield and quality which could be improved by evaluating different pea cultivars for the selection of desirable types. The available pea germplasm including pea cultivars have significant variability for most of the growth, yield and quality attributes. Pea is grown as autumn and winter crop in the months of September and October in Khyber Pakhtunkhwa and other provinces of Pakistan (Nazir and Bantel, 1994). Pea is considered a cash crop in the country but its cultivation and production is limited as compared to other countries of the world due to which the country pay more for the import of pulses including pea to meet the national food requirements (Aslam et al., 2000). Moreover, improper fertilizer use and unavailability of improved varieties are other obstacles which limit the economical crop growth and yield per unit area.
Application of fertilizers such as phosphorus increases the availability of nitrogen and potassium which improve plant growth (Saeed et al., 2004). The application of phosphorus efficiently increases number of branches, reproductive nodes, root development, flower initiation and seed and fruit development. The crop production on more than 30% of the world arable land is limited by phosphorus availability (Tesfaye et al., 2007). In addition, phosphorus has an enhancing impact on plant growth and biological yield (Srivastava et al., 1998; Nassar and Ismail, 1999). It can create deeper and vigorous roots (Sharma, 2002) but it is the most sensitive nutrient to soil pH. Early ripening in plant is induced by the application of phosphorus fertilizer. It also decreases grain moisture which improves crop and seed quality (Malakooti, 2000). Phosphorus fertilizer makes plants efficient to photosynthesis as well as enhances the activity of rhizobium bacteria which fix atmospheric nitrogen (Omar et al., 1990). Graham and Rosas (1979) reported that phosphorus deficiency limits nitrogen fixation which reduces growth and yield of pea crop.
Keeping in view the importance of phosphorus and improved pea cultivar in improving the growth and yield of pea crop, a research study was conducted to find out an appropriate dose of phosphorus for better growth and yield of pea and to identify the suitable pea cultivar for general cultivation in Swabi valley to enhance farmer’s income.
Materials and Methods
This experiment was conducted in the research farm of Agricultural Research Station (ARS) Swabi Khyber Pakhtunkhwa during autumn season, 2016. The experiment was laid out in Randomized Complete Block Design (RCBD) with Split Plot arrangements having two factors. Phosphorus fertilizer was considered main plot factor and its different levels were applied to the main plots while pea was used as sub plot factor and the cultivars of it were applied to the sub plots. The experiment comprised of twenty treatments combinations which were replicated three times. Five levels of phosphorus fertilizer i.e. P0= 0 kg ha-1, P1=30 kg ha-1, P2=60 kg ha-1, P3=90 kg ha-1 and P4=120 kg ha-1 and four pea cultivars i.e. V1=Meteor, V2= Samrina Zard, V3= Leena Pak and V4= Pea-2009 were studied in the experiment. Diammonium phosphate (DAP) was used as a source of phosphorus which is used internationally for the same purpose. However, DAP also contain 18% nitrogen but that amount of nitrogen was counted as basal doze. Recommended dose of the other nutrients i.e. nitrogen and potash were applied to the experimental plots @ 90 and 65 kg per hectare counting 18% nitrogen in the DAP. The pea cultivars which were used in the experiment are early maturing (60-70 days) as well as determinate cultivars usually grown as short duration pea crop varieties in the autumn season. Plot size was maintained 3.6 m2 whereas row- row and plant – plant distances were kept 30 and 10 cm, respectively. Data were recorded on leaflets plant-1, absolute growth rate (AGR), pods plant-1, pod length, 100-seeds weight, nodules plant-1, root weight and pods yield using ten randomly selected plants from each sub-plot. All other cultural practices were applied uniformly to all the experimental plots.
Soil analysis
Soil analysis was conducted by taking random samples from the experimental area before laying out the experiment at the Directorate of Soil and Plant Nutrition, Agricultural Research Institute, Tarnab Peshawar. The analysis showed that the soil was silt loam having Nitrogen (0.024%), Phosphorus (1.7%), Potassium (1.80%), Organic matter (0.48%) and pH of soil was 7.7.
Statistical analysis
Data were analyzed using analysis of variance (ANOVA) technique as outlined by Steel et al. (1997) using statistical software Statistix version 8.1 while mean values of the significant results were compared using Least Significant Difference (LSD) test.
Absolute growth rate
Absolute growth rate (AGR) is the index which is used to measure plant growth rate per unit time by the following formula;
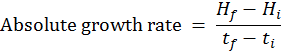
Hi = Initial height (cm); Hf=Final height (cm); ti= Initial time (days); tf= Final time (days).
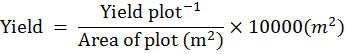
Pod yield ha-1 (tons)
Total yield from first harvest to last harvest was taken and converted into yield ha-1 using formula:
Results and Discussion
Leaflets plant -1
Leaflets plant-1 contributes to the photosynthetic area of plant and adds in plant productivity. Mean square values showed highly significant differences (P≤0.01) for main effects (phosphorous levels and pea cultivars) whereas their interaction effect was non-significant (Table 1).
Mean values of leaflets plant -1 regarding phosphorus levels ranged from 102.61 60 73.70. Maximum leaflets plant-1 (102.61) were produced by plants receiving 90 kg P ha-1 and minimum leaflets plant -1 (73.70) were recorded in the plants receiving no phosphorus. Mean data of pea cultivars for leaflets plant-1 varied between 100.87 and 93.55. The cultivar Leena Pak displayed maximum leaflets plant-1 (100.87) followed by Samrina Zard (93.55). Minimum leaflets plant-1 (72.63) was manifested by cultivar Pea-2009 (Table 2). Phosphorus is essential for growth and Nitrogen fixation which enhances the capability of plants to produce more number of leaflets plant-1 (Ashraf et al., 2011). It is evident from the findings of Amjad and Anjum (2002) that tall cultivars possessed comparatively more number of leaves than the dwarf ones. Vegetative growth of pea plant is affected by both genetic and environmental factors whose interaction further modifies plant growth. Hence, variation in pea cultivars could be due to their genetic composition and adaptability.
Absolute growth rate (AGR) (cm day-1)
Plant growth rate identifies the performance of plant vegetative and reproductive growth and enhances plant productivity. Analysis of variance (ANOVA) showed highly significant differences (P≤0.01) among phosphorus levels for absolute growth rate of pea plants. However, non-significant effect of pea cultivars and their interaction with phosphorus was observed for absolute growth rate (Table 1).
Mean data of phosphorus levels for absolute growth rate varied from 3.31 to 1.56 cm day-1. Maximum absolute growth rate (3.31cm day-1) were recorded in plants fertilized with 90 kg ha-1 phosphorus followed by (2.81 cm day-1) in plants applied with 60 kg ha-1 phosphorus. Minimum absolute growth rate (1.56 cm day-1) was observed in the plants applied with phosphorus at the rate of 0 kg ha-1, respectively. Among the pea cultivars, mean values of absolute
Table 1: Mean squares for Leaflets plant-1, absolute growth rate (AGR), pods plant-1, pod length, 100 seeds weight, nodules plant-1, root weight and yield ha-1 as affected by phosphorus levels and pea cultivars.
|
Mean squares |
Rep (A) |
Phosphorus (B) |
Error (A*B) |
Cultivar (C) |
B*C |
A*B*C |
|
Leaflets plant-1 |
1624.56 |
1983.04** |
237.17 |
2541.8** |
191.25 |
177.29 |
|
(AGR) (cm day-1) |
0.54 |
5.39* |
0.96 |
1.03 |
0.50 |
0.54 |
|
Pods plant-1 |
0.30 |
18.3** |
1.40 |
67.7** |
3.66** |
0.87 |
|
Pod length (cm) |
0.89 |
1.84** |
0.11 |
14.14** |
0.40 |
0.51 |
|
100 seeds weight (g) |
0.817 |
141.18** |
19.35 |
153.39** |
16.33 |
8.98 |
|
Nodules plant-1 |
2.17 |
221.1** |
0.42 |
283.6** |
12.85** |
0.31 |
|
Root weight (g) |
6.26 |
3.56** |
0.06 |
23.93** |
0.78** |
0.16 |
|
Yield ha-1 (tons) |
0.30 |
12.35** |
0.57 |
30.26** |
4.72 |
2.40 |
*: Significant; **: highly Significant.
Maximum absolute growth rate was observed in pea cultivar Leena Pak followed by Samrina Zard (2.34 cm day-1) and Meteor (2.34 cm day-1). Lowest value (2.20 cm day-1) of absolute growth rate was recorded for pea cultivar Pea-2009 (Table 2). Our results are in line with the findings of Kumar (2011), Amjad and Anjum (2002), Abdalsalam and Al-Shebani (2010) and Iqbal et al. (2012). Kumar (2011) observed that the increase in absolute growth rate was due to the application of phosphorus as it plays an important role in photosynthesis, respiration and fat metabolism. Amjad and Anjum (2002) stated that vegetative growth of pea cultivar was affected by both genetic and environmental factors. Abdalsalam and Al-Shebani (2010) found that phosphorus application enhanced all growth and yield parameters for mungbean. The findings of Iqbal et al. (2012) are also similar with present results who reported significant increase in absolute growth rate with the application of appropriate phosphorus fertilizer.
Table 2: Mean values of Leaflets plant-1, absolute growth rate (AGR), pods plant-1 and pod length as affected by phosphorus levels and pea cultivars.
|
Phosphorous (Kg ha-1) |
Leaflets plant-1 |
AGR (cm day-1) |
Pods plant-1 |
Pod length (cm) |
|
0 |
73.70 B |
1.56 c |
13.29 C |
8.48 C |
|
30 |
82.70 AB |
2.46 abc |
14.36 BC |
9.04 B |
|
60 |
97.19 A |
2.81 ab |
15.30 AB |
9.29 AB |
|
90 |
102.61 A |
3.31 a |
16.43 A |
9.53 A |
|
120 |
76.07 B |
2.08 bc |
13.89 BC |
9.03 B |
|
LSD value |
21.096 |
0.9249 |
1.6210 |
0.4719 |
|
Cultivars |
||||
|
Meteor |
78.77 B |
2.34 |
14.40 B |
8.64 B |
|
Samrina zard |
93.55 A |
2.42 |
15.22 B |
8.44 B |
|
Leena Pak |
100.87 A |
2.81 |
17.06 A |
8.69 B |
|
Pea-2009 |
72.63 B |
2.20 |
11.94 C |
10.52 A |
|
LSD value |
13.370 |
NS |
0.9370 |
0.7183 |
|
P×C |
NS |
NS |
* |
NS |
Mean followed by similar letter(s) in column do not differ significantly from one another; Mean followed by upper case letter(s) in column are significant at 1% level of probability; Mean followed by lower case letter(s) in column are significant at 5% level of probability; NS: Non Significant; *: Significant at 1% level of probability and P × C = Interaction of phosphorus and Cultivars.
Pods plant-1
Mean square values revealed highly significant differences (P≤0.01) of the main effects i.e. phosphorus and pea cultivars for pods plant-1. The interaction effect of phosphorus fertilizer and pea cultivars was also highly significant for this trait as depicted in the mean square table (Table 1).
Among phosphorus levels mean values for pods plant-1 ranged from 13.29 to 16.43. Highest value of pods plant-1 (16.43) was recorded for the plots supplied with 90 kg P ha-1 while the lowest value (13.29) of this trait was observed in the plots receiving no phosphorus. Mean values pertaining to various pea cultivars varied between 14.14 and 17.06 for pods plant-1. Maximum value of pods plant-1 (17.06) was manifested by the pea cultivar Leena Pak followed by Samrina Zard (15.22). The minimum pods plant-1 (14.14) was produced by Pea-2009 cultivar. The interaction of phosphorus and pea cultivars shows that maximum pods plant-1 (18.50) were produced by cultivar Leena Pak supplied with 90 kg P ha-1 while, cultivar Pea-2009 fertilized with no phosphorus produced minimum pods plant-1 (10.13), respectively (Table 2).
Increase in the number of pod plant-1 with the application of phosphorus might have resulted from more prominent growth of the plant which in turn had enhanced number of pods per plant (Hussen and Yirga, 2013). If the dose of phosphorus increases from optimum level it shows negative response because it may deactivate the function of other nutrients present in the plant for plant growth (Ali et al., 2014). Significant differences were observed among different cultivars regarding pods per plant in studies of Amjad and Anjum (2002). It has also been observed that number of pods plant-1 depends upon genetic composition of cultivars (Habib and Zamin, 2003).
Pod length (cm)
It is evident from the mean square table that the main effects of phosphorus levels and pea cultivars had significant effect (P≤0.01) on pod length while non significant effect was observed in the interaction of pea cultivars and phosphorus levels for pod length (Table 1).
Mean data of phosphorus for pod length varied from 8.48 to 9.53 cm. Mean values regarding phosphorus levels showed that maximum length of pod (9.53 cm) was measured in plants treated with 90 kg P ha-1 followed by (9.29 cm) treated with 60 kg P ha-1. Plants treated with 30 and 120 kg P ha-1 showed statistically similar results (9.04 cm) and (9.03 cm) respectively. The minimum pod length (8.48 cm) was measured in plants treated with no phosphorus. Data regarding pea cultivars showed that maximum length of pod (10.52 cm) was measured in Pea-2009 cultivar followed by (8.69 cm) and (8.44 cm) in Leena Pak and Samrina Zard cultivars respectively, that were statistically similar (Table 2).
Results regarding pod length are in agreement with that of Kandil et al. (2013) who stated that length of pod increases with increasing level of phosphorus. The results related to pea cultivars are similar to the results of Amjad and Anjum (2002) in which minimum pod length (6.28cm) was recorded for Meteor cultivar. Studies from previous research indicated that pea cultivars vary greatly in size and shape of pods (Gentry, 1971; Makasheva, 1983; Muehlbauer and McPhee, 1997). According to Habib and Zamin (2003) pod length varies among different pea cultivars (Habib and Zamin, 2003).
100 Seeds weight (g)
Highly significant differences (P≤0.01) were observed among phosphorus levels and pea cultivars for 100-seed weight whereas their interaction effect was non-significant (Table 1).
Mean values pertaining to phosphorus level for 100-seed weight ranged from 32.00 to 40.66 g. Maximum 100-seeds weight (40.66 g) was recorded in the phosphorus level 90 kg ha-1 while minimum 100-seeds weight (32.00 g) was observed in 0 kg ha-1 phosphorus level. Mean data of pea cultivars for 100-seed weight varied from 32.80 to 39.73 g. The highest value of 100-seeds weight (39.73g) was exhibited by cultivar Pea-2009 followed by pea cultivar meteor (33.86 g). Pea cultivar Samrina Zard showed lowest value of 100-seeds weight (32.80 g) (Table 3). The present findings were supported by Sarwar et al. (2012) who reported that phosphorus significantly enhances weight of grain.
Studies conducted by Hussain (1983) showed that application of phosphorus to legumes would greatly improve seed yield per unit area. Our results are also in accordance with the study of Duke (1981) and Mehrani (2002) who reported that 100-seeds could vary greatly among cultivars which mainly depends upon the genotypes as well as climatic and soil conditions of the experimental area.
Table 3: Mean values of 100 seeds weight, nodules plant-1, root weight and yield ha-1 as affected by phosphorus levels and pea cultivars.
|
Phosphorous (Kg ha-1) |
100 seeds weight (g) |
Nodules plant-1 |
Root weight (g) |
Yield ha-1 (tons) |
|
0 |
32.00 B |
8.87 E |
3.40 D |
3.15 B |
|
30 |
33.83 B |
10.84 D |
4.22 B |
3.99 B |
|
60 |
35.50 AB |
15.33 B |
4.58 A |
4.02 B |
|
90 |
40.66 A |
19.97 A |
4.67 A |
5.71 A |
|
120 |
32.91 B |
13.29 C |
3.75 C |
3.30 B |
|
LSD Value |
6.0270 |
0.8901 |
0.3471 |
1.035 |
|
Cultivars |
||||
|
Meteor |
33.86 B |
12.55 C |
3.59 C |
3.38 BC |
|
Samrina zard |
32.80 B |
15.10 B |
4.03 B |
4.32 AB |
|
Leena Pak |
33.53 B |
18.66 A |
5.90 A |
5.92 A |
|
Pea-2009 |
39.73 A |
8.33 D |
2.97 D |
2.53 C |
|
LSD Value |
3.0097 |
0.5635 |
0.4055 |
1.558 |
|
P×C |
NS |
* |
* |
NS |
Mean followed by similar letter(s) in column do not differ significantly from one another; Mean followed by upper case letter(s) in column are significant at 1% level of probability; Mean followed by lower case letter(s) in column are significant at 5% level of probability; NS; Non Significant; *: Significant at 1% level of probability and P×C= Interaction of phosphorus and Cultivars.
Nodules plant-1
Analysis of variance (ANOVA) revealed highly significant differences (P≤0.01) among main and interaction effects of phosphorus levels and pea cultivars for nodules plant-1 (Table 1).
Mean values of phosphorus levels for nodules plant-1 ranged from 8.87 to 19.97. Maximum nodules plant-1 (19.97) were recorded in the plants fertilized with of 90 kg P ha-1 followed by plants supplied with 60 kg P ha-1. Minimum nodules plant-1 (8.87) was produced by the plants in the control treatment. Mean data of pea cultivars for nodules plant-1 varied between 8.33 and 18.66. Highest value of nodules plant-1 (18.66) was observed for pea cultivar Leena Pak followed by Samrina Zard (15.10) while pea cultivar Pea-2009 showed lowest value of nodules plant-1 (8.33). In case of interaction, the maximum nodules cultivar plant-1 (26.25) were produced by Leena Pak fertilized with 90 kg P ha-1 whereas the minimum nodules plant-1 (2.75) were noted in Pea-2009 in the control treatment (Table 3). The present results are supported by Kumar (2011) who stated that increasing levels of phosphorus encouraged root growth and number of nodules. Phosphorus shortage in soybean resulted in poor nodulation, reduced seed viability, and decreased percentage of fully expanded seeds (Bishnoi et al., 2007). Phosphorus may be a major limitation of legumes under low nutrient environments because there is a considerable need for P in the N2 fixation process (Tsvetkova and Georgiev, 2003). It is evident from a study that pea cultivars gave response to phosphorus levels and hence increases nodule formation in the roots (Tarawali and Quee, 2014).
Root weight (g)
Mean square data showed highly significant differences (P≤0.01) among the main effects i.e. phosphorus levels and pea cultivars and their interaction effect for root weight (Table 1).
Mean values among phosphorus levels for root weight varied between 3.40 and 4.67 g. Maximum root weight (4.67 g) were found in plots treated with 90 kg P ha-1 which was statistically not different from that of 60 kg P ha-1 (4.58 g). The lowest root weight (3.40 g) was recorded in plots treated with no phosphorus. Mean values pertaining to different pea cultivars show that maximum root weight (5.90 g) was recorded for cultivar Leena Pak followed by cultivar Samrina Zard (4.03 g) while the minimum root weight (2.97 g) was noted in Pea-2009.The interaction show that heaviest weight of roots (6.96 g) was weighed in cultivar Leena Pak with application of 90 kg P ha-1 whereas, the lowest root weight (1.93 g) was observed in cultivar Pea-2009 supplied with no phosphorus (Table 3).
The results are similar to the findings of Ali et al. (2014) who reported that shoot, root and grain weight increases with the application of phosphorus. Plants fed with phosphorus create deeper and more abundant roots (Sharma, 2002). Different pea varieties showed different root weight may be due to difference in their genetic make-up.
Yield ha-1 (tons)
Analysis of variance (ANOVA) regarding yield ha-1 showed highly significant differences (P≤0.01) for different levels of phosphorus and pea cultivars while the interaction effect among them was found non- significant (Table 1).
Mean values of phosphorus levels for yield ha-1 ranged between 3.15 and 5.71 tons. Maximum yield ha-1 (5.71 tons) resulted in plots treated with 90 kg P ha-1 followed by plants supplied with 60 kg P ha-1. Minimum yield ha-1 (3.15 tons) was obtained from the control treatment. Mean data regarding pea cultivars for this trait varied from 2.53 to 5.92 tons. Pea cultivar Leena Pak produced maximum yield ha-1 (5.92 tons) while the minimum yield ha-1 (2.53 tons) was obtained from cultivar Pea-2009 (Table 3).
Cultivars that mature early produce more yield as compared to that which mature late (Habib and Zamin, 2003). The results are in agreement with Patel et al. (1984) who observed significant increase in yield of pea when 40 kg ha-1 of P2O5 is applied and reported that increase in phosphorus dose, increases yield. Islam and Noor (1982) declared that plants grown without phosphorus fertilizers produce the lowest pod yield. Ali et al. (2014) confirmed that as we increase phosphorus, yield increases. If the dose of phosphorus increases from optimum level it shows negative response because it may deactivate the function of other nutrients present in the soil for plant growth (Magelanga, 2013). Arshad (1993) reported that legume crops respond positively to phosphorus application and increases yield. Whereas, Ghafoor (1985) examined from his studies that maximum yield is obtained when 100 kg P2O5 ha-1 is applied. Yield is determined by the interaction of many inherent characters with soil, climate and agronomic conditions (Makasheva, 1983). Higher number of leaves means more photosynthesis and ultimately more yield (Muehlbauer and McPhee, 1997). In the study of Amjad and Anjum (2002) the cultivars Meteor and Samrina Zard had more number of leaves and thus resulted in higher yields. Cultivars that result in lower number of leaves producing more yield might be due to the inherent yield potential of the cultivar.
Conclusions and Recommendations
It is concluded from this research that application of phosphorus significantly increases growth and yield of peas. Phosphorus applied at the rate of 90 kg ha-1 increased the growth and yield of pea. Pea plants supplied with no or excess phosphorus resulted in poor vegetative and reproductive growth. Among pea cultivars, Leena Pak showed the best results with respect to growth and yield in the climatic and environmental conditions of Swabi. Further research is suggested to explore phosphorus benefits and high yielding pea cultivars for Swabi.
Acknowledgements
Thanks to my parents, the countless times you kept the children during your hectic schedules will not be forgotten. Your encouragement and helping me when the times got rough are much appreciated and duly noted.
Novelty Statement
The research presents a new idea about absolute growth rate will add a new parameter to future researchers.
Author’s Contribution
Sana khan conducted the experiment, collect data, did statistical analysis and wrote the paper in supervision of Faiza Aman and under co-supervision of Muhammad Ismaeel. Muhammad ismaeel helped in analysis of data. Zafar Ali helped in completing the research. Sadeed Iqbal and Taimur Khan helped in collection of data in field and also helped in writing paper. Mehboob Alam made correction in papers.
Conflict of interest
The authors have declared no conflict of interest.
References
Abdalsalam, A.A. and Y.A. Al-Shebani. 2010. Effect of various nitrogen and phosphorus fertilization levels on growth, yield and yield attributes of local mungbean (Vigna radiata L.) R. Wilczek) in Yemen. Egypt. J. Appl. Sci., 25 (2A): 57-71.
Ali, M.A., A. Ali, M.I. Ahmad, S.W. Hassan, S.R. Khan and A.A. Abid. 2014. Phosphorus effects on growth and yield parameters of mungbean. Sci. Int., (Lahore). 26(4): 1821-1824.
Amjad, M. and M.A. Anjum. 2002. Performance of nine pea cultivars under faisalabad conditions. Pak. J. Agric. Sci. pp. 39.
Arshad, A., 1993. Effect of different planting methods and phosphorus levels on the performance of vigna radiata. Pak. J. Agric. Res., 14: 2- 3.
Ashraf, M.I., M.A. Pervez, M. Amjad, R. Ahmad and M. Ayub. 2011. Qualitative and quantitative response of pea (Pisum sativum L.) Cultivars to judicious applications of irrigation with phosphorus and potassium. Pak. J. Life Soc. Sci., 9(2): 159-164.
Aslam, M., I.A. Mahmood, T. Sultan and S. Ahmad. 2000. Inoculation approach to legume crops and their production assessment in Pakistan. A review. Pak. J. Biol. Sci., 3: 193-195. https://doi.org/10.3923/pjbs.2000.193.195
Bishnoi, U.R., G. Kaur and M.H. Khan. 2007. Calcium, phosphorus, and harvest stages effects soybean seed production and quality. J. Plant Nutr., 30: 2119-2127. https://doi.org/10.1080/01904160701700608
Duke, J.A., 1981. Hand book of legumes of world economic importance. Plenums press New York. pp. 199-265. https://doi.org/10.1007/978-1-4684-8151-8
Gentry, H.S., 1971. Pisum resources: A preliminary survey. Plant Genet. Res. Newsl., 25: 3-13.
Ghafoor., 1985. Effect of NPK Applications in various combination on the growth and seed yield of spring mungbean (Vigna radiata). M.Sc. thesis, Dept. Agron., Univ. Agric., Faisalabad, Pakistan.
Graham, P.H. and J.C. Rosas. 1979. Phosphorus fertilization and symbiotic nitrogen fixation in common bean. Agron. J., 71: 925-926. https://doi.org/10.2134/agronj1979.00021962007100060007x
Habib, N. and M. Zamin. 2003. Off-season Pea cultivation in Dir Kohistan Valley. Asian J. Plant Sci., 2(3): 283-285. https://doi.org/10.3923/ajps.2003.283.285
Hussain, A., 1983. Isolation and identification of effective root nodule bacteria for important grain legumes of Pakistan. Project report. Department of Science Soil, University of Agriculture Faisalabad. pp. 73.
Hussen, S. and F. Yirga. 2013. Effect of Phosphorus fertilizer on yield and yield components of chickpea (Cicer arietinum) at Kelemeda, South Wollo, Ethiopia. Int. J. Soil Crop Sci., 1(1): 1-4.
Iqbal. S., H.Z. Khan and H. Shaheen. 2012. Growth and yield responses of mungbean (Vigna radiata) to different levels of phosphorus application under different tillage systems. Int. J. Agric. Sci., 4: 22-27.
Islam, M.S. and S. Noor. 1982. Performance of groundnut under different levels of phosphate fertilization in grey floodplain soils in Bangladish J. Agric. Res. 7: 35- 45.
Kandil, H., N. Gad and M.T. Abdelhamid. 2013. Effects of different rates of phosphorus and molybdenum application on two varieties common bean of (Phaseolus vulgaris L). J. Appl. Food Technol., 3(3): 8- 16.
Khichi, P., P. Chandan, J. Chauhan, J. Srinivas and M. Bhagat. 2016. Varietal evaluation of garden pea under semi arid conditions of Vidharba region. Int. J. F. Sci., 6(1): 20-24.
Khokhar, K.M., 2014. http://www.agricorner.com/production-status-of-major-vegetables-in-pakistan-their-problems-and-suggestions/
Kumar, J., 2011. Effect of phosphorus and sulphur application on performance of vegetable pea (Pisum sativum l.) Cv. Pant matar-2. Indian. J. Res. 34: 292 - 295.
Magelanga, A.A., 2013. Effects of phosphorus levels on yield and yield components of drought resistant bean lines in southern highlands of Tanzania. Master in crop science of Sokoine University of agriculture. Morogoro, Tanzania.
Makasheva, R.K., 1983. The pea. Oxonian Press Pvt. Ltd., New Delhi, India. pp. 78-107.
Malakooti, M.J., 2000. Sustainable agriculture and yield increment by optimum fertilizer utilization in Iran. 2nd edition. Agric. Extension Publications, Iran.
Mehrani, P., 2002. Genetic diversity in local and exotic pea (Pisum sativum L.) germplasm for morphological traits and SDS-PAGE markers. M.Phil. Dissertation, Quaid-e-Azam University, Islamabad.
Muehlbauer, E.J. and K.E. Mcphee. 1997. Peas. In: The physiology of vegetable crops (Ed. H.C. Wein). CAB International, Wallingford, UK. pp. 429-459.
Nassar, K.E., and K.M. Ismail. 1999. Effect of ascorbic acid and phosphorus application on lupin yield (Lupinu stermis L.) grown on sandy soil. Egypt J. Appl. Sci., 14(10): 357-368.
Nazir, S. and B.R. Bantel. 1994. In: Crop production. Natl. Book Found. Islamabad 1: 317-318.
Omar, N.M., A.M. Shaheen and M.O. Bakry. 1990. The residual effect of sulphur and phosphorus action on the growth yield of pea (Pisum sativum L.) plants. Egypt J. Agron., 15(1-2): 87.
Patel, R.G., M.P. Patel, H.C. Patel and R.B. Patel. 1984. Effect of graded levels of N and P on Growth, yield and economics of summer Mungbean. Indian J. Agron., 21: 291-294.
Saeed. M., H.M. Akram, M.S. Iqbal, A. Yar and A. Ali. 2004. Impact of fertilizer on the seed yield of chickpea. Int. J. Agric. Biol., 6(1): 108-109.
Sarwar, M., M.E. Akhtar, S.I. Hyder and M.Z. Khan. 2012. Effect of biostimulant (Humic Acid) on yield, phosphorus, potassium and boron use efficiency in peas. Persian Gulf Crop Prot., 1(4): 11-16.
Sharma, A.K., 2002. Bio-fertilizers for sustainable agriculture. Agrobios Indian Publications, pp. 456.
Srivastava, T.K., I.P.S. Ahlawat and J.D.S. Panwar. 1998. Effect of phosphorus, molybdenum and bio-fertilizers on productivity of pea (Pisum sativum L.) India. J. Plant Physiol., 3(3): 237.
Steel, R.G.D., J.H. Torrie and D.A. Dickey. 1997. Principles and procedures of statistics. Abionomial approach. 3rd edition. McGraw Hill Companies, inc. New York, USA.
Tarawali, A.R. and D.D. Quee. 2014. Performance of ground nut (Arachis hypogaea L) varieties in two agro-ecologies in Sierra Leone. Afr. J. Agric. Res., 9(19): 1442-1448. https://doi.org/10.5897/AJAR2014.8660
Tesfaye, M., J. Liu, D.L. Allan and C.P. Vance. 2007. Genomic and genetic control of phosphate stress in legumes. Plant Physiol., 144: 594-603. https://doi.org/10.1104/pp.107.097386
Tsvetkova, G.E. and G.I. Georgiev. 2003. Effects of phosphorous nutrition on the nodulation, nitrogen fixation and nutrient use efficiency of Bradyrhizobium japonicum soybean symbiosis. Bulg. J. Plant, pp. 331-335.
To share on other social networks, click on any share button. What are these?


