

Emergence of Novel Unique Recombinant Forms and Multiple Subtypes in Gag-Pol Region of HIV-1 in Punjab, Pakistan


Emergence of Novel Unique Recombinant Forms and Multiple Subtypes in Gag-Pol Region of HIV-1 in Punjab, Pakistan
Amreen Zahra1*, Mushtaq A. Saleem2, Hasnain Javed3, Muhammad Azmat Ullah Khan4 and Abdul Rauf Shakoori4

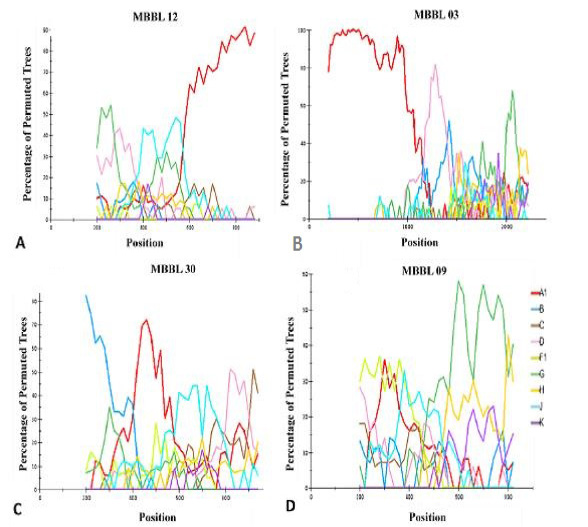
Genotypic analysis of HIV-1 Gag sequences: Boot scanning analysis of Subtype A1in HIV-1 Gag gene region. (A) isolate MBBL12 (B) isolate MBBL03 (C) isolate MBBL30 (D) isolate MBBL09. Parametrical analysis was done using the following: Window: 200 bp, step: 20 bp, gapstrip: on, reps: 100, Kimura (2-parameter), T/t: 2.0.

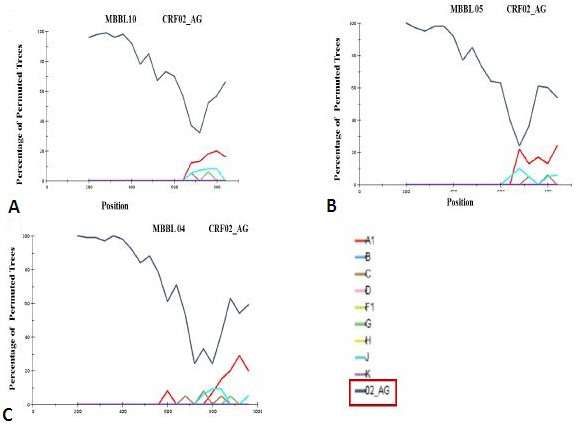
Genotypic analysis of HIV-1 Gag circulating recombinant forms (CRFs): Boot scanning analysis of HIV-1 Gag gene with CRFs. (A) isolate MBBL10; (B) isolate MBBL05; (C) isolate MBBL 04. Conditions used were the following: Window: 400 bp, step size: 40 bp, gapstrip: on, reps: 100, Kimura (2-parameter), T/t: 2.0.
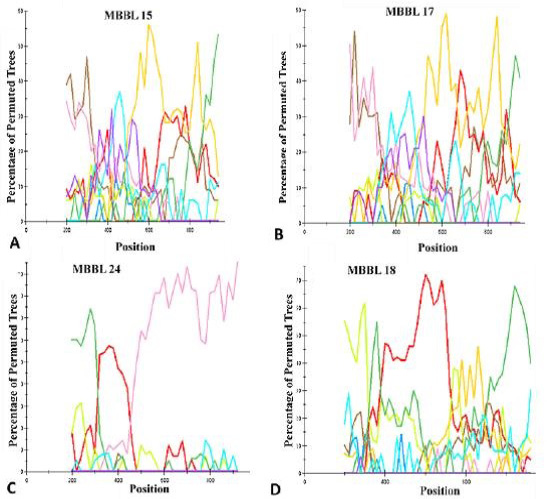
Genotypic analysis of Pol Unique Recombinant Forms (URFs): Boot scanning analysis of HIV-1 Pol gene with URFs. (A) isolate MBBL15; (B) isolate MBBL17; (C) isolate MBBL 24; (D) isolate MBBL18. The conditions used for this analysis were the following: Window: 400 bp, step size: 40 bp, gapstrip: on, reps: 100, Kimura (2-parameter), T/t.
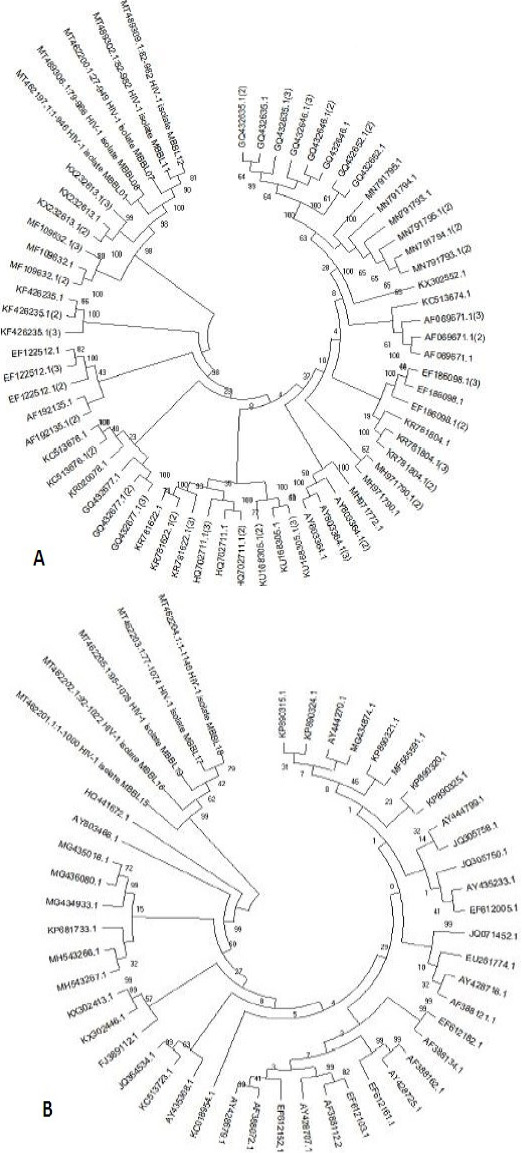
Phylogenetic tree of 17 Gag isolates (A) and 13 pol isolates (B), generated via Neighbor Joining method. The distances were computed using the Kimura 2- parameter model. Evolutionary analysis were conducted in MEGA X. Sum of branch optimum length = 0.66910448. 1000 bootstrap test replicates are shown near to scale with branch lengths as those of the evolutionary distances used to infer the phylogenetic tree.


