

DNA Methylation of the CYP1A1 Promoter Region is Associated with Anti-tuberculous Drug-induced Hepatic Injury


DNA Methylation of the CYP1A1 Promoter Region is Associated with Anti-tuberculous Drug-induced Hepatic Injury
Qi Ren, Shufeng Sun, Chen Niu, Yuhong Li, Yingzhi Chong, Biao Li, Guoying Zheng and Fumin Feng*

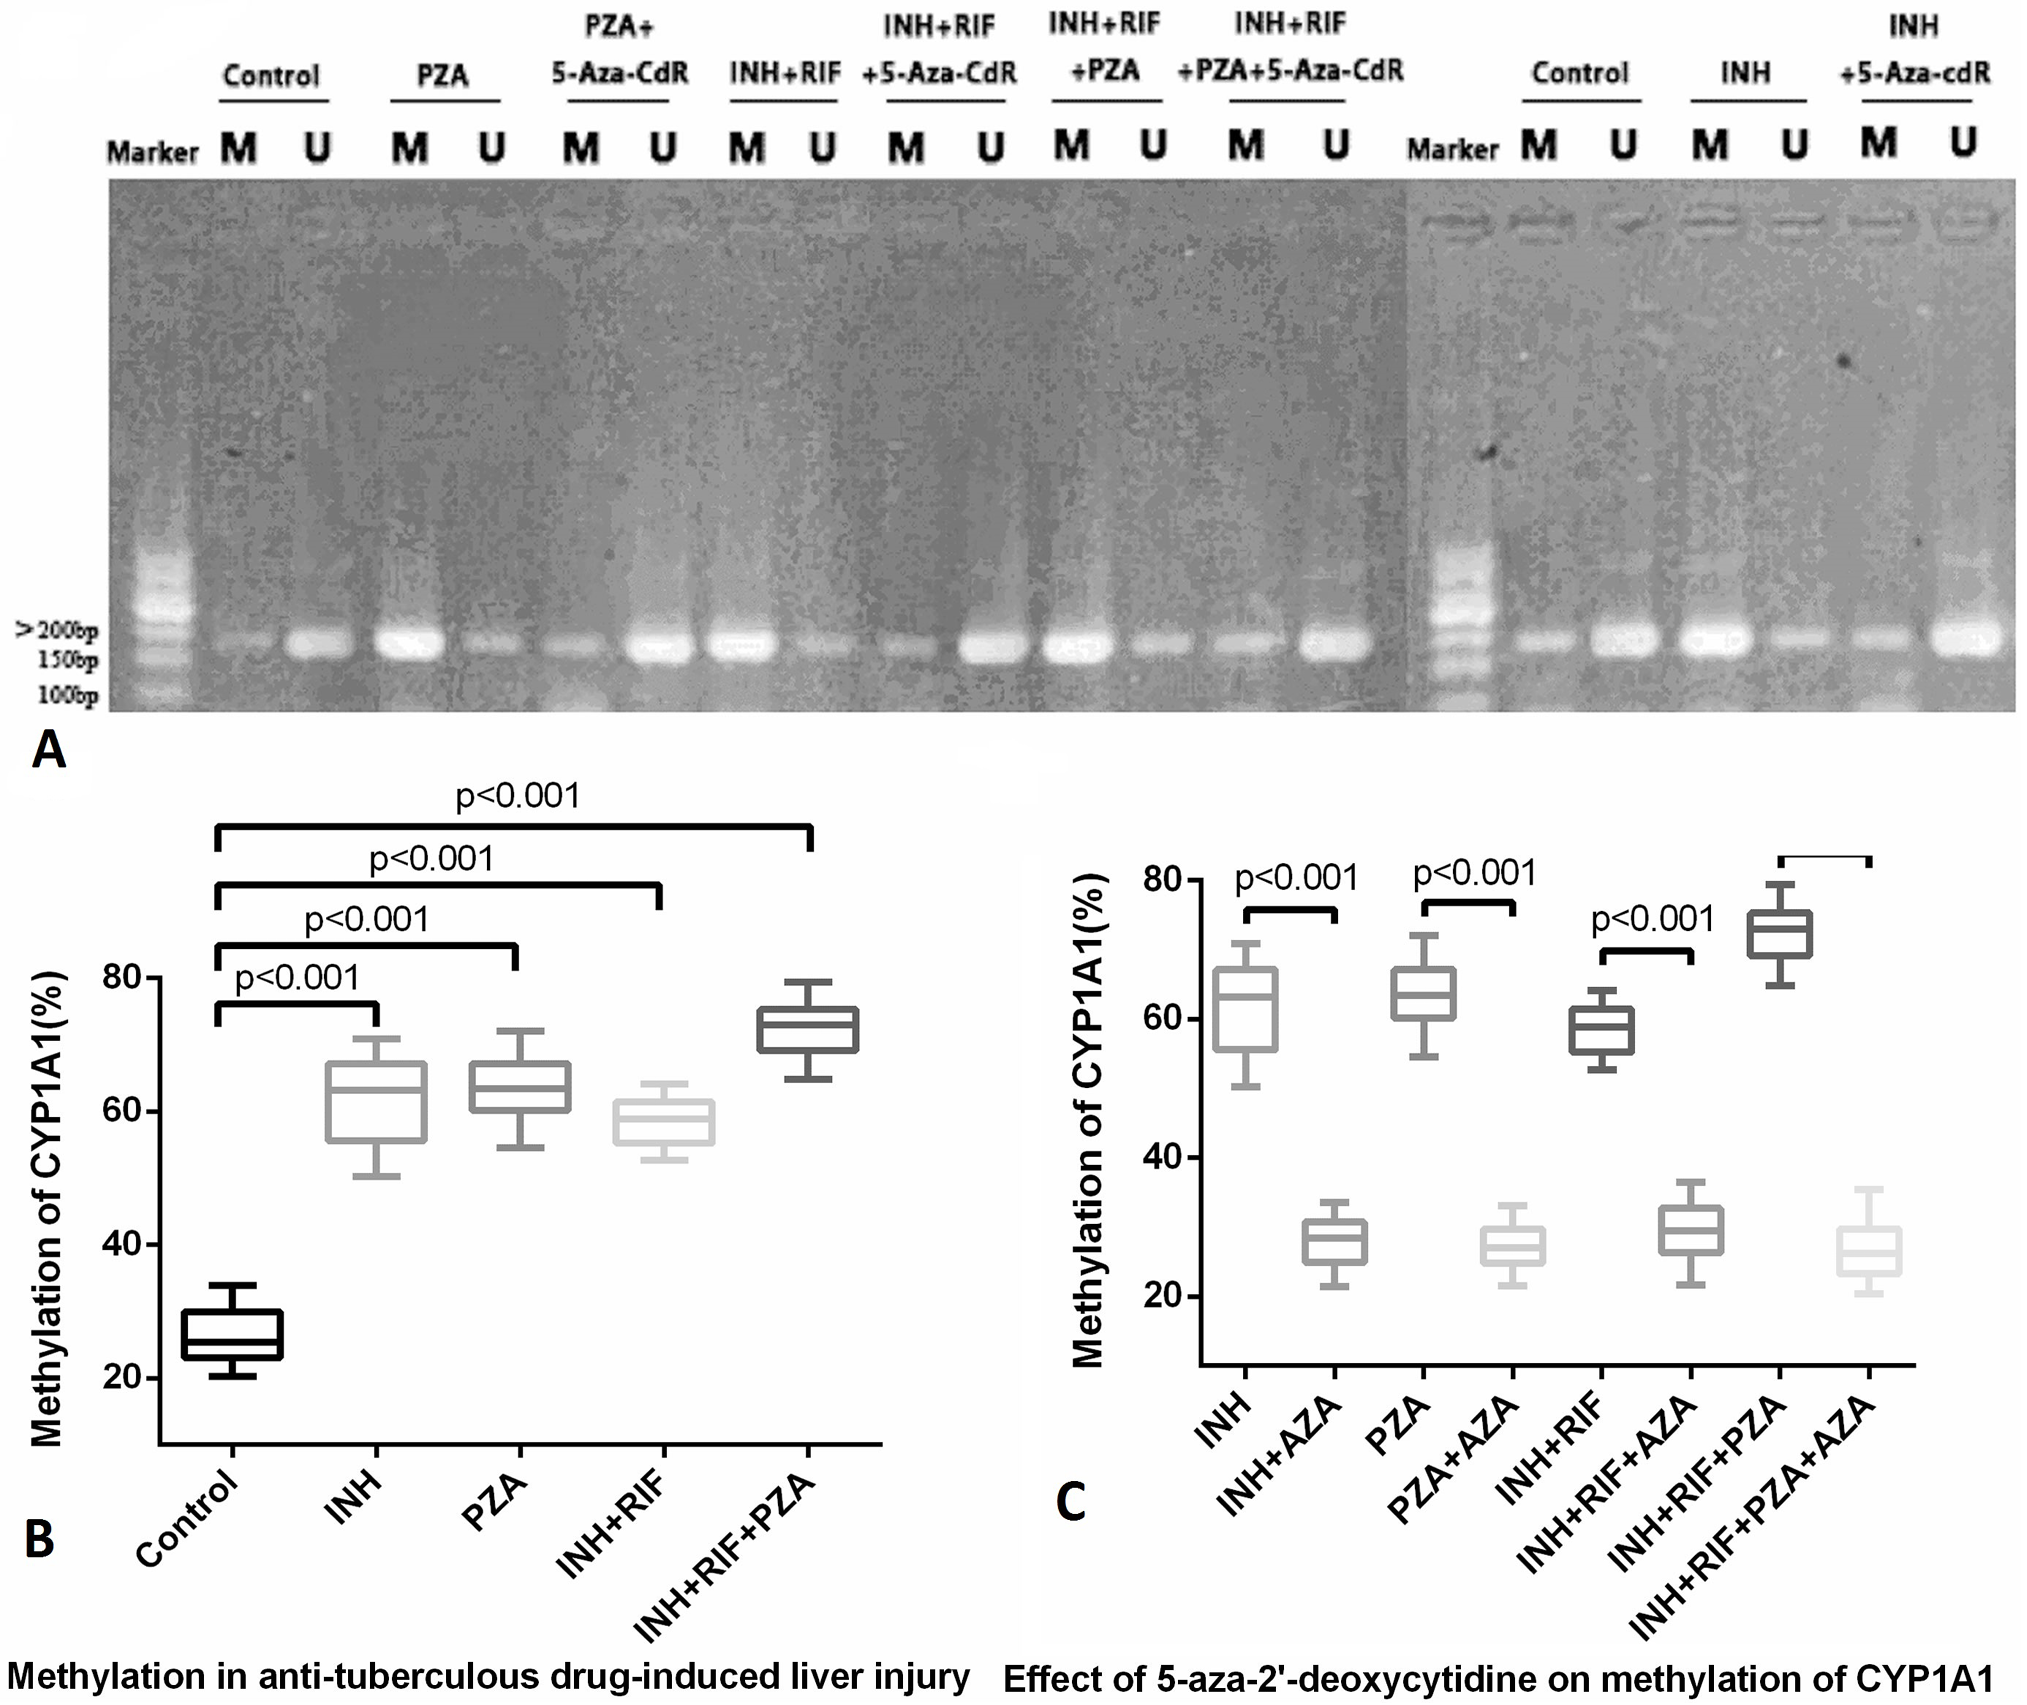
Methylation of CpG islands in the promoter region of the CYP1A1 gene in different drug groups. (A) Methylation of CpG islands in the CYP1A1 promoter region of each group was detected by methylation-specific PCR (MSP). Here, M represents a methylated band and U represents an unmethylated band. Both bands are 194 bp in length. (B, C) MSP methylation, % = methylation OD/ (methylated OD + non-methylated OD) × 100%. Each group included 6 parallel samples.
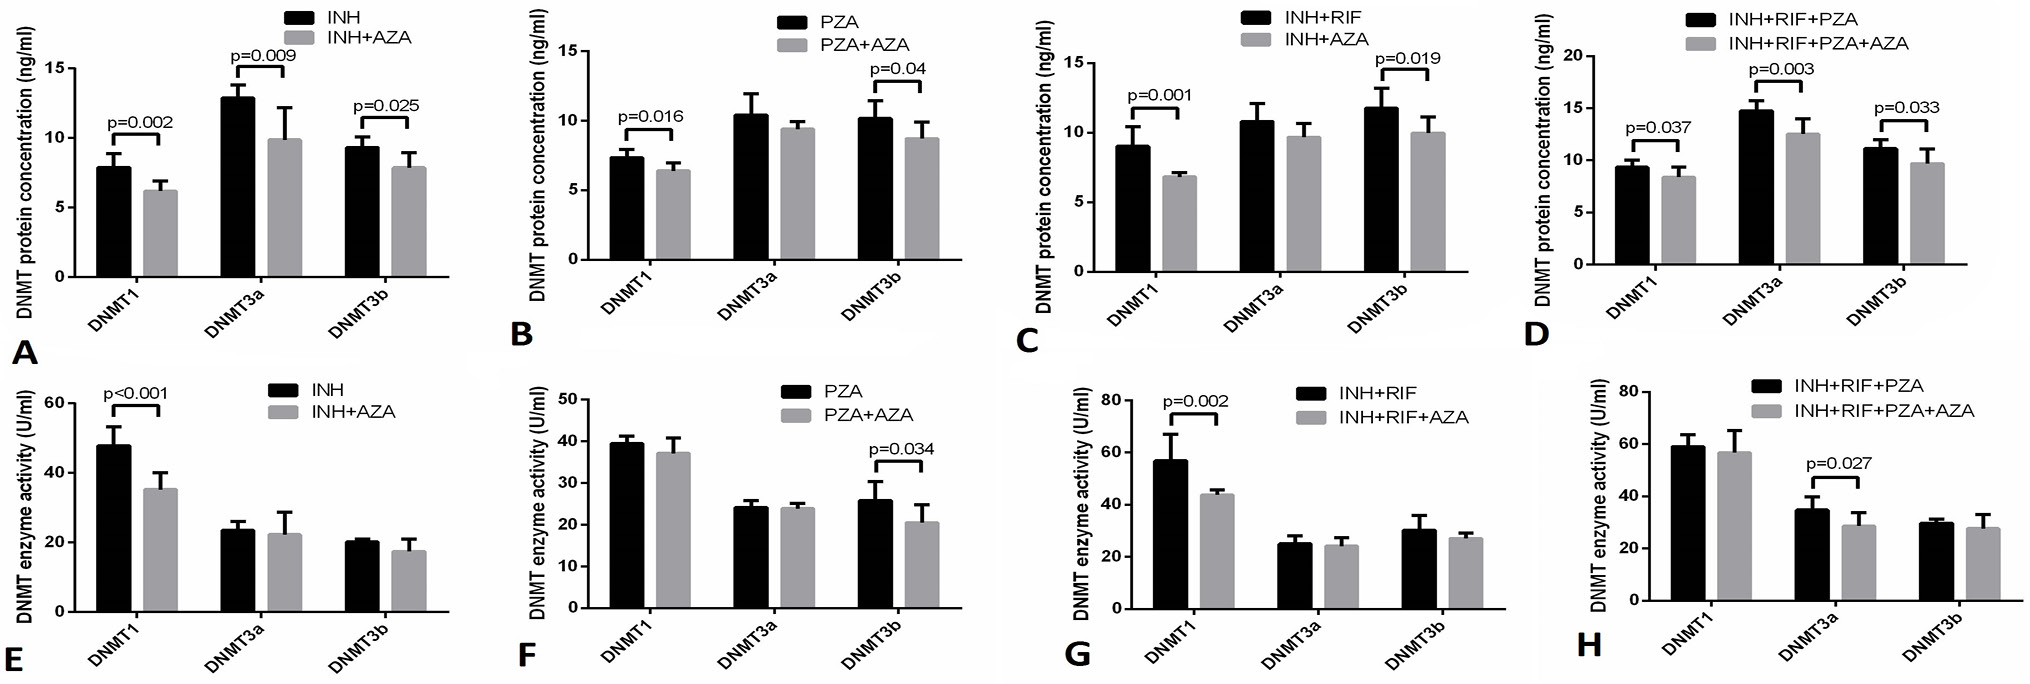
Changes in DNMT1, DNMT3a, and DNMT3b protein expression and enzyme activity in various drug groups with AZA. The cells were incubated with each of the anti-tuberculosis drugs (isoniazid, INH; pyrazinamide, PZA; INH + rifampicin, RIF; or INH + RIF + PZA) or their combination with AZA (10 μM) for 12 h. Protein concentration and enzyme activity were detected by ELISA. Each group included 6 parallel samples, each of which was measured three times.

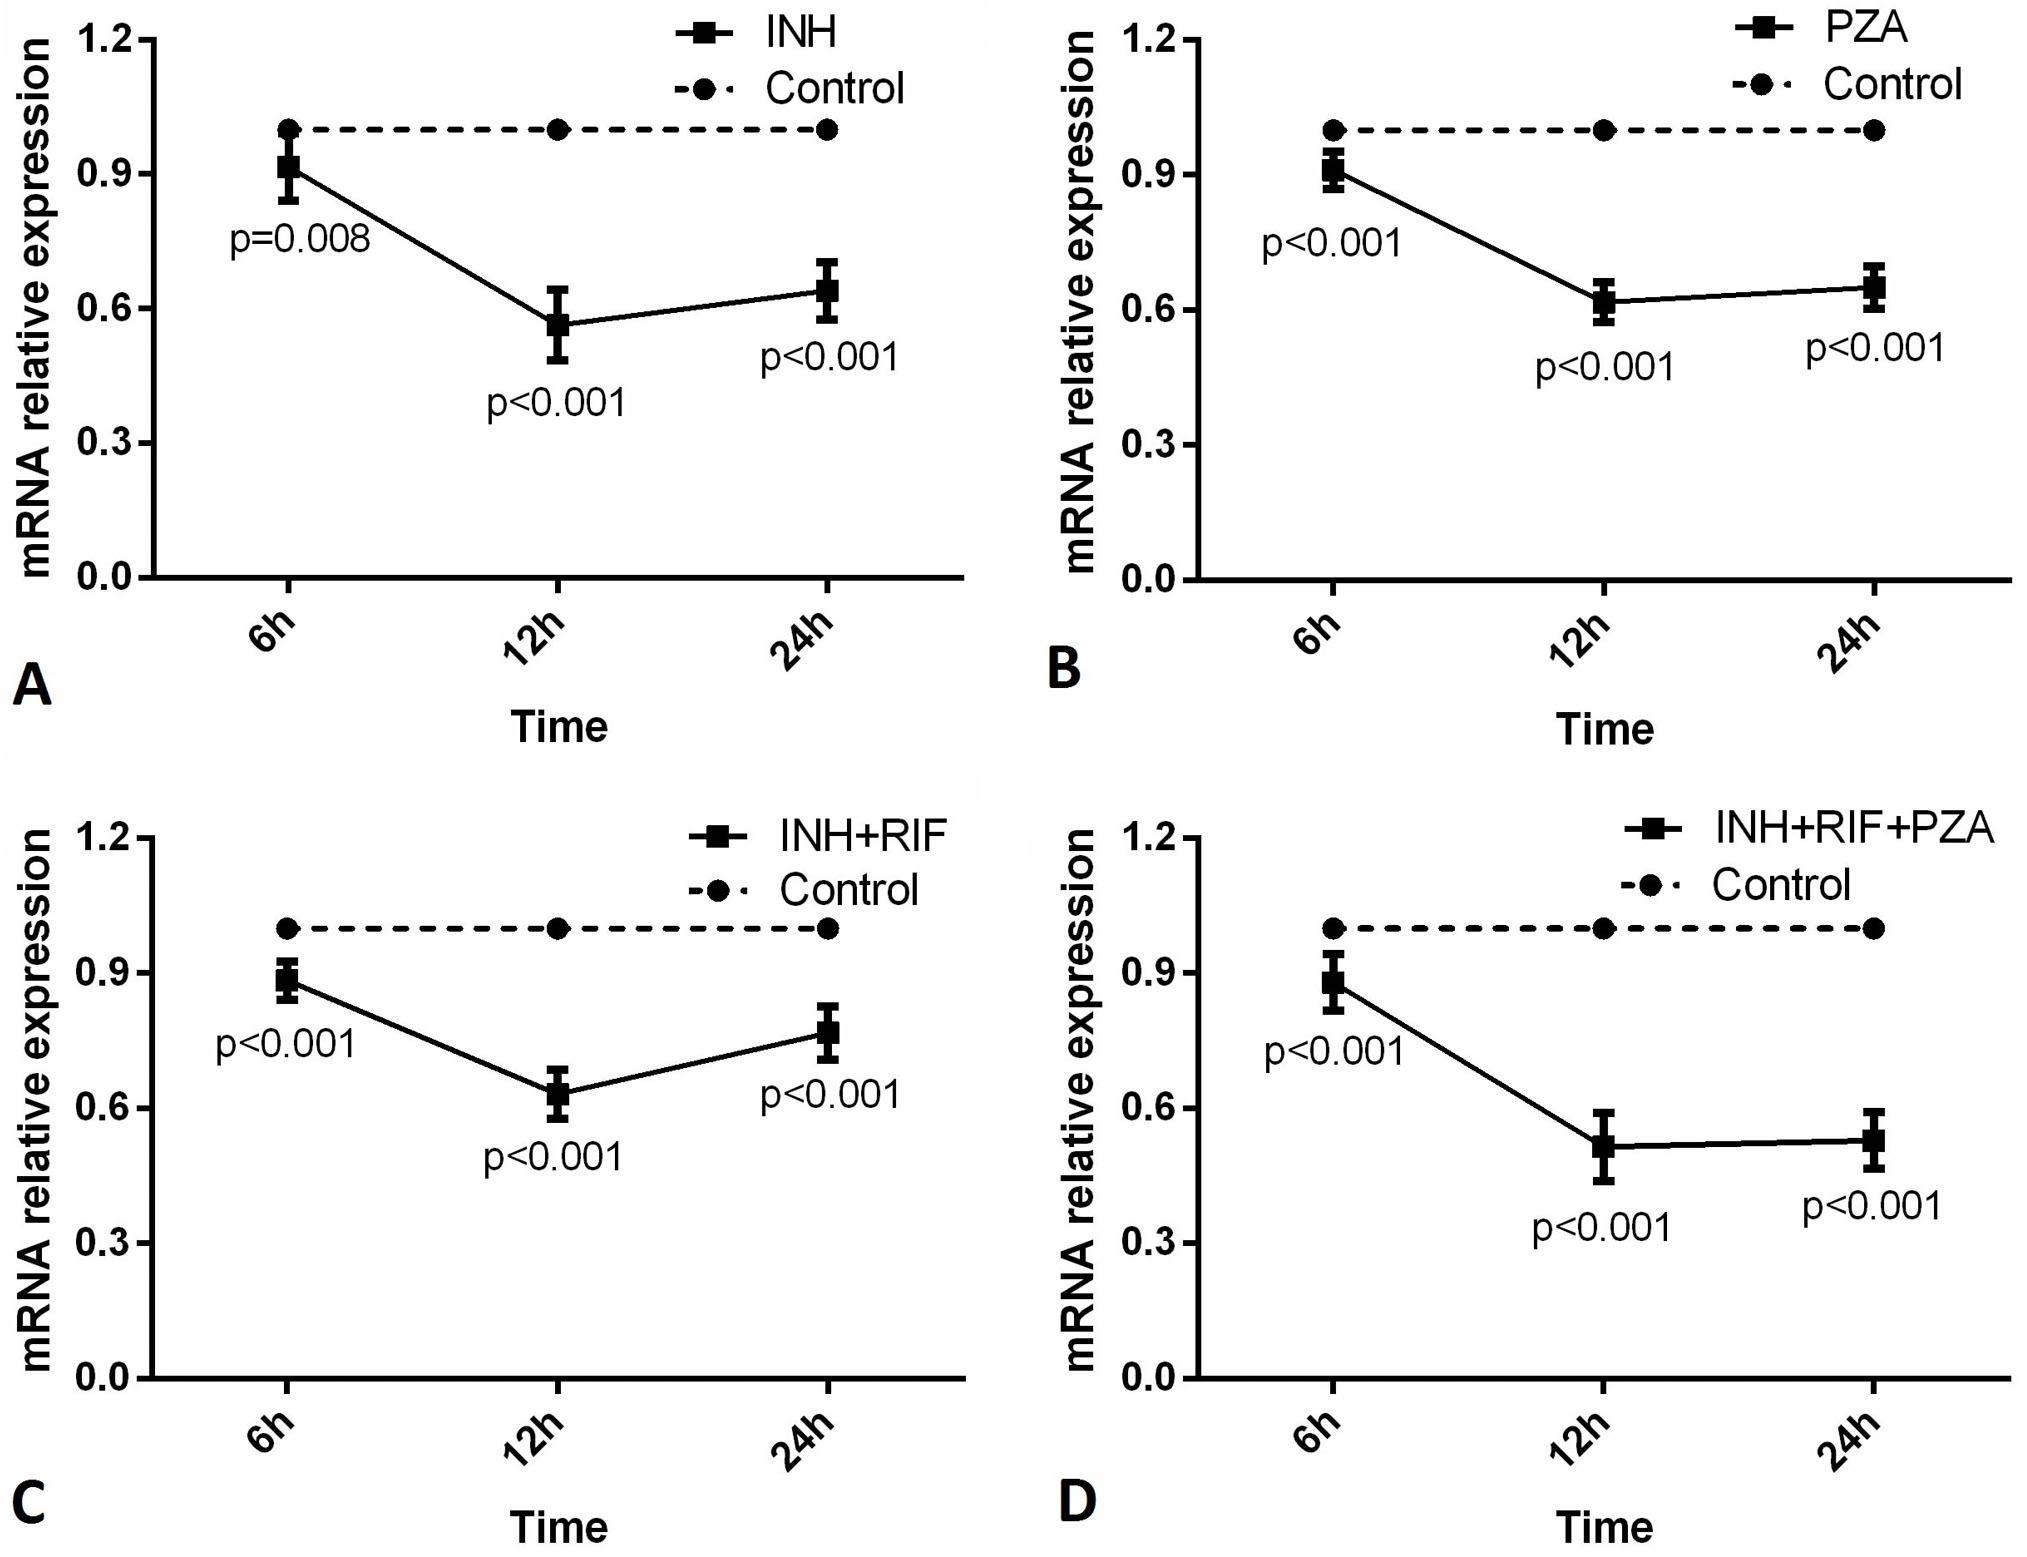
CYP1A1 mRNA expression in different drug groups at different time points. Quantitative real-time PCR was used to detect mRNA in the drug and control groups (A: isoniazid, INH, B: pyrazinamide, PZA, C: INH + rifampicin (RIF), D: INH + RIF + PZA). Each group included 6 parallel samples, each of which was measured 3 times.
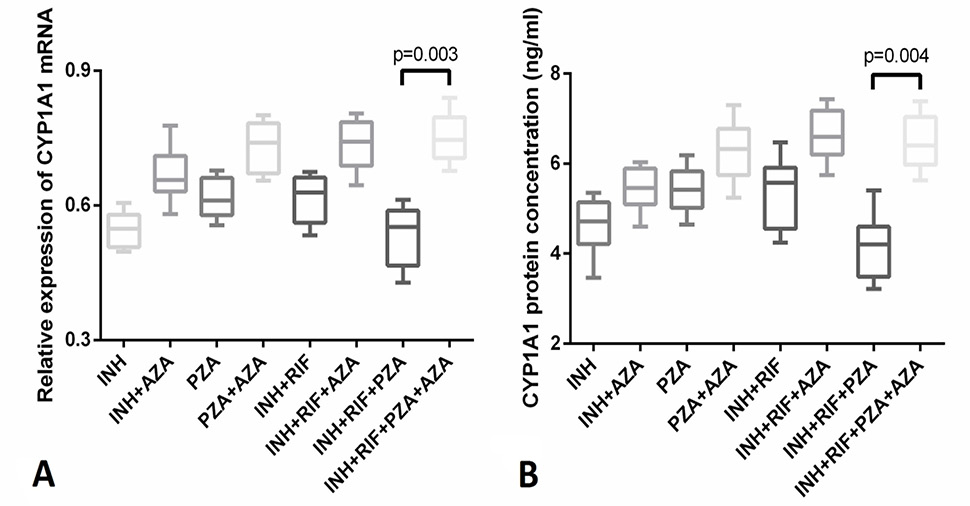
Changes in CYP1A1 mRNA and protein expression in different drug groups treated with AZA. Cells were cultured for 12 h with each of the anti-tuberculosis drugs (isoniazid, INH; pyrazinamide, PZA; INH + rifampicin, RIF; or INH + RIF + PZA) or their combination with AZA (10 μM). (A) CYP1A1 mRNA expression was detected by quantitative real-time PCR. (B) CYP1A1 protein expression was detected by ELISA. Each group included 6 parallel samples, each of which was measured 3 times.
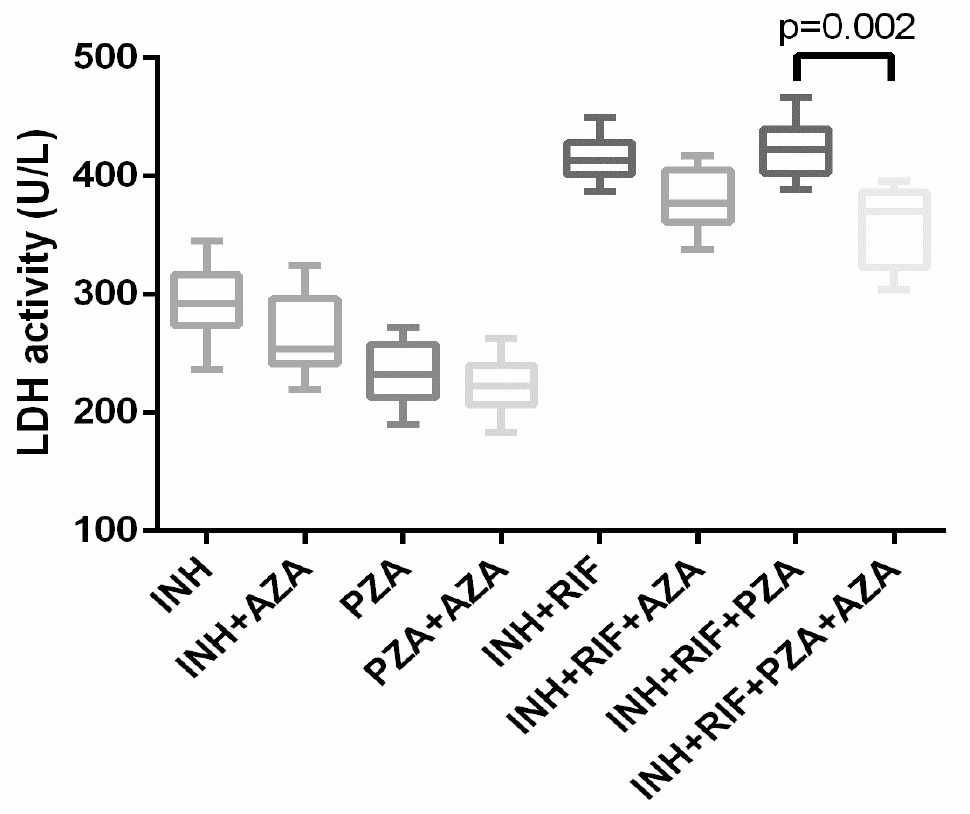
LDH activity in different drug groups treated with AZA. The cells were cultured for 12 h with each of the anti-tuberculosis drugs (isoniazid, INH; pyrazinamide, PZA; INH + rifampicin, RIF; or INH + RIF + PZA) or their combination with AZA (10 μM). LDH enzyme activity was detected using the micro-enzyme method. Each group included 6 parallel samples, each of which was measured 3 times.
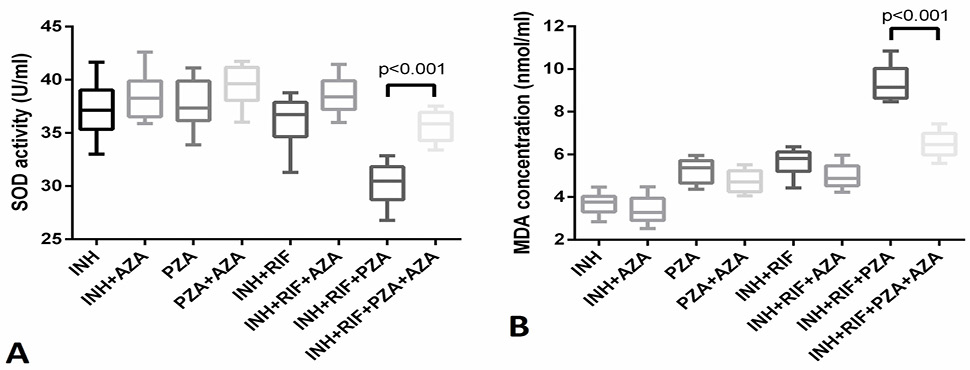
Changes in SOD and MDA in different drug groups treated with AZA. Cells were cultured for 12 h with each of the anti-tuberculosis drugs (isoniazid, INH; pyrazinamide, PZA; INH + rifampicin, RFP; or INH + RFP + PZA) or their combination with AZA (10 μM). The enzyme activity of SOD was detected by the hydroxylamine method, and the MDA concentration was detected by the TBA method. Each group included 6 parallel samples, each of which was measured 3 times.


