
Analysis of Beef Cattle Value Chain and Value Addition Activities: Empirical Evidence from Toke Kutaye and BakoTibe Districts, West Shewa Zone, Oromia National Regional State, Ethiopia


Research Article
Analysis of Beef Cattle Value Chain and Value Addition Activities: Empirical Evidence from Toke Kutaye and BakoTibe Districts, West Shewa Zone, Oromia National Regional State, Ethiopia
Dabesa Wegari and Fikiru Temesgen Gelata*
Department of Agribusiness and Value Chain Management, Ambo University, P.O.Box: 19, Ambo, Ethiopia.
Abstract | The aim of the study was identifying actors of the beef cattle value chain and their value addition activities in Toke Kutaye and BakoTibe Districts, West Shewa Zone, Oromia National Regional State, Ethiopia. The data were collected from both primary and secondary sources. For this study, both primary and secondary sources of data were collected. The primary data were collected from 376 producers, 30 fatteners, 20 traders, 10 butchers, 12 hotels, 10 consumers and other institution actors; totally 476 respondents by using interview schedule, site visit and personal observation. Data analysis was made using descriptive and inferential statistics. In the study areas, the major beef cattle value chain actors were input suppliers, producers, traders, fatteners, processors, retailers, consumers and governmental and non-governmental institutions. The core functions of the chain actors were input supply, production, marketing/trading, processing, retailing and consumption of the product.Therefore, the required recommendations were creating strong horizontal and vertical linkages/relationships between the chain actors and on mutually beneficial actions for the smallholder farmers.
Received | November 14, 2020; Accepted | January 19, 2021; Published | April 04, 2021
*Correspondence | Fikiru Temesgen Gelata, Department of Agribusiness and Value Chain Management, Ambo University, P.O.Box: 19, Ambo, Ethiopia; Email: fiktems@gmail.com
Citation | Wegari, D. and F.T. Gelata. 2021. Analysis of beef cattle value chain and value addition activities: Empirical Evidence from Toke Kutaye and BakoTibe Districts, West Shewa Zone, Oromia National Regional State, Ethiopia. Sarhad Journal of Agriculture, 37(2): 377-385.
DOI | https://dx.doi.org/10.17582/journal.sja/2021/37.2.377.385
Keywords | Analysis, Beef cattle, Constraints and opportunities, Smallholder farmers, Value chain
Introduction
Ethiopia has the largest livestock inventory in Africa which are not managed to maximize its value for meat production. Large numbers of livestock are held for several years to supply draught animal power and milk for the family in the highland areas, and these old animals do not produce the best meat. Ethiopia has the potential to increase the volumes and values of domestic and export sales of meat and its products. This could be achieved by increasing meat exports, expanding commercialization of production and marketing of livestock, diversifying into other products and boosting domestic consumption (LMD, 2018).
Livestock value chain analysis is essential to understand the existing markets; structure and relationships; participation of different actors and the constraints that limit the growth of livestock sector and the compositeness of smallholder farmers (IFAD, 2017). Comprehensive analysis of a value chain is a prerequisite for the development of value chains because the analysis is critical for understanding markets, relationships among actors, the participation of different actors and the main constraints that limit the growth of the enterprise as well as the competitiveness of the beneficiaries. Results from value chain analyses have been used in the development sector to design market-oriented interventions and value chain upgrading strategies that are beneficial to smallholder farmers, particularly the marginalized groups, in the developing countries (IFAD, 2017). However, to the extent that the constraints and opportunities faced by the marginalized groups differ, the interventions are likely to be different for the different categories of smallholder farmers.
Thus, value chain research is crucial to identify the main actors of the chain and map the value chain. Because animals are not managed for high off-take, or to maximize their value for meat production and the current contribution of and earning from the livestock is below potential at both micro and macro levels in the country in general and to the study areas specifically.
Materials and Methods
Description of the study areas
This study was conducted in two major livestock producing districts, namely Toke Kutaye and BakoTibe Districts of West Shewa Zone, Oromia National Regional State, in central Ethiopia. Description of each district was given below.
Bako tibe is one of the districts of West Showa zone, Oromia national regional state, Ethiopia. It is located at 250 km west of Addis Ababa, 125 km of Ambo, the capital city of West Showa zone and 81 km east of West Wollega. The district is bordered with the south, west and north by East Wollega zone and on the East by Ilu Galan district. The administrative center of the district is Bakko town. The district has three Agro-ecological zones, in which 12 % is high land (Dega), 37% is mid-land (Woina-dega), and 51% is low land (Kolla). The average rainfall varies between 1000-1200 mm, with anaverage temperature of 13.2°C - 27°C. This district has 3 urban and 28 rural PAs. The total area of the district is 637.19 square kilometer. The total population of the district is 133,799, out of which 68,401 are male, and 65,398 are female with a population density of 210 people per Square Kilometer which is greater than the Zone average of 152.8 (CSA, 2016).
Toke Kutaye is one of the districts in the west shewa zone, Oromia Region of Ethiopia. Toke Kutaye is bordered on the east by the Ambo district, on the north by Midakegn, on the west by Chalia. The administrative town of the district is Guder. The district located 12 kilometers west of Ambo town, at a distance of about 137 kilometers away from Addis Ababa on the Addis Ababa Nekemte main road. The 2007 national census reported a total population for this district of 119,999, of whom 59,798 were men and 60,201 were women; 15,952 or 13.29% of its population were urban dwellers. The majority of the inhabitants said they practiced Ethiopian Orthodox Christianity, with 49.48% of the population reporting they observed this belief, while 32.8% of the populations were Protestant, and 16.25% practised traditional beliefs.The economic source of the district depends on agriculture, and its produces. Agriculture accounted for more than 90% of the economy of the district.
Sources of data and methods of data collection
Both primary and secondary sources of data were used for the study. Primary data were collected from traders, fatteners, butchers, local abattoir, hotels/restaurants and consumers. Secondary data were collected from various publications and reviews (from the internet), material studies, data from the National Statistics Agency, Ministry of Agriculture, district offices and other relevant sourceswere used as secondary sources. Interview schedules, site visits, focus group discussion and structured observation methods of data collection and information obtained from different government and non-governmental organizations were used as primary sources. Both qualitative and quantitative types of data were collected for the study. The qualitative data were collected using a Participatory research approach/ key informant interview, site visits and structured observations and quantitative data were collected using interview schedules.
Sampling techniques and sample size determination
Three stage sampling techniques were used for this study. In the first stage, two districts namely, Toke Kutaye and BakoTibe districts were selected purposively from western shewa zone based on the existing potential of cattle production, fattening practices and marketing of beef cattle in the districts. In the second stage, with the consultation of districts’ livestock experts, three kebeles from each district were selected randomly. In the third stage, by using simple random sampling technique, 376 sample households were selected based on (Yamane, 1967) formula described below at 5 % confidence level.
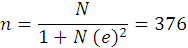
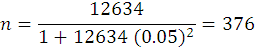
Where,
n= designates the sample size the research uses (376); N= designates total number of households (12634); e= designates maximum variability or margin of error 5%; 1= designates the probability of the event occurring.
Additionally, other actors like Traders, fatteners, butchers, local abattoir, hotels/restaurants and consumers from each district were purposively selected based on their amount availability because value chain considers from input supply to the final consumers including all traders.
Descriptive and inferential analysis
Data analysis was employed descriptive and inferential statistics such as mean, percentage, t-test and chi2-test by using STATA software.
During the data analysis that was dealt with the identification of the value chain actors, and their respective functions and major constraints and opportunities. Simple descriptive statistics such as percentage and mean and inferential statistics such as t-test and chi2-test were employed by using STATA software and was presented in the form of tables and figures. This was used in the description of socio-economic and demographic characteristics of the respondents and test significance difference of variables between the districts using appropriate techniques. Mean, and t-test was used in continuous variables while percentage and chi2-test in categorical variables.
Results and Discussion
Socio-economic and demographic characteristics of the sampled household producers (Continuous variables)
Table 2 showed that the total mean age of the household head respondents was 42.59 years. The mean age of the respondents in Toke Kutaye district was 43.39 years and 41.59 in BakoTibe district. Age of the respondents in the two districts has a significantdifference at less than 5% significance level. The total mean of household size for the sampled household producers was 7.24. The mean household size of the respondents in Toke Kutaye and BakoTibe districts was 7.78 and 6.55, respectively. Household size showed significance difference at less than 1% significance level in the two districts.
The mean of the total number of cattle owned by the household respondents in the year was 10.80. The mean of a number of cattle owned by the household respondents in Toke Kutaye and BakoTibe districts in the year was 9.37 and 12.61, respectively and there was a significantdifference at less than 1% significance level in the two districts. The mean annual sampled household income in Toke Kutaye and BakoTibe districts was ETB 64507.14 and 48775.30, respectively and the total mean annual income in the two districts was ETB 57561.70. Mean annual sampled household income in the two districts has a significant difference at less than 1% significance level. The mean of total land owned by household respondents in the two districts was 2.25 hectares, and there was a significantdifference at less than 1% significance level between the two districts. The mean number of beef cattle sold in the year of household respondents in Toke Kutaye and BakoTibe districts was 1.58 and 1.90, respectively. The mean of the total number of beef cattle sold in the year in both districts was 1.72 and hada significantdifference at less than 5% significance level.
Socio-economic and demographic characteristics of the sampled household producers (dummy variables)
Table 3 showed that about 93.62% of the sampled household respondents in the two districts weremale-headed while the remaining (6.38%) was female-headed household. From this, about 93.33% was male-headed households, and only 6.67% was female-headed in Toke Kutaye district, and 93.98% was male-headed, and 6.02% was a female-headed household in BakoTibe district. Sex of household head has no significant difference between the two districts. The majority (55.59%) of sampled household heads’ education level was a primary school which is followed by secondary school (22.34%), illiterate (21.28%) and certificate (0.80%). The education level of the household head has a significantdifference at less than 5% significance level in the two districts. The same table showed that 92.82% of the respondents were married, and 7.18% of them were divorced, and there was no significantdifference between the two districts. Majority of the sampled household heads’ religion were Protestant (49.73%), and Orthodox (36.97%) and the remaining were Wakefata (11.44%) and Muslim (1.86%). The religion of sampled household head has a significantdifference at less than 1% significance level in the two districts. Almost 68% of the respondents were followers of Orthodox Christianity while the remaining 32% were Muslims, Protestants and others in Addis Ababa city.
Beef cattle value chain analysis
Beef cattle value chain actors and their functions in the study areas: Feed supply: The major types of livestock feed resources in the study areas were pasture (58.51%) and crop residue (30.05%) that were used for livestock production purpose (Table 4). The study showed that pasture was the largest feed resource type and followed by crop residue in the study areas. In both districts, there is significantvariation at less than 10% significance level on the type of livestock feed resources.
Provision of veterinary service: Table 4 showed that majorities (92.29%) of household respondents hadbeen used veterinary services in the study year and there is no significantdifference between the two districts in case of using veterinary services.
Access to credit: Access to credit also another important input for cattle production. The study showed (Table 4) that about 84.04% of household respondents were not used or no access to credit service that affectscattle production and marketing in the study areas. For access to credit services, there is a significantdifference between the two districts at less than 10% significance level.
Table 1: Sample size of the study areas.
|
Name of selected districts |
Name of selected kebeles |
Number of household producers in the kebeles |
Sample of household producers in the kebeles |
|
Toke Kutaye |
Naga File |
1420 |
42 |
|
Birbirsafdogoma |
3430 |
104 |
|
|
lencha |
2160 |
64 |
|
|
BakoTibe |
Dembi Dima |
1054 |
30 |
|
Seden Kite |
1820 |
54 |
|
|
Bacara Oda Gibe |
2750 |
82 |
|
|
Total |
6 |
12634 |
376 |
Source: The districts’ livestock and fishery dev’t office, 2019.
Table 2: Socio-economic and demographic characteristics of the sampled household producers (Continuous variables).
|
Variables |
Mean of household respondents in the districts |
|||
|
Toke Kutaye (N = 210) |
BakoTibe (N = 166) |
Total (N = 376) |
T-value |
|
|
Age of household head in years |
43.39 |
41.59 |
42.59 |
2.13** |
|
Household size in numbers |
7.78 |
6.55 |
7.24 |
5.48*** |
|
Total number of cattle owned in numbers in the year |
9.37 |
12.61 |
10.80 |
-6.85*** |
|
Total annual income in birr |
64507.14 |
48775.30 |
57561.70 |
3.91*** |
|
Total land owned in hectares |
2.73 |
1.64 |
2.25 |
8.53*** |
|
Grazing land owned in hectares |
0.51 |
0.47 |
0.49 |
0.90 |
|
Cultivating land owned in hectares |
2.22 |
1.17 |
1.76 |
10.37*** |
|
Total number of beef cattle sold in numbers in the year |
1.58 |
1.90 |
1.72 |
-2.51** |
|
Average selling price of beef cattle in the year in birr |
11126.67 |
9793.97 |
10538.3 |
4.90*** |
*** = significant at p ≤ 1% level, ** = significant at p ≤ 5% level; Source: field survey, 2019.
Table 3: Demographic characteristics of the sampled household producers (Categorical variables).
|
Variables |
Categories |
Percentage of sampled household producers in the two districts |
||||||
|
Toke Kutaye (N = 210 (55.85%)) |
BakoTibe (N = 166 (44.15%)) |
Total (N = 376 (100%)) |
X2-value |
|||||
|
% |
N |
% |
N |
% |
N |
|||
|
Sex of household head |
Men |
93.33 |
196 |
93.98 |
156 |
93.62 |
352 |
0.06 |
|
Women |
6.67 |
14 |
6.02 |
10 |
6.38 |
24 |
||
|
Education level of household head |
Illiterate |
24.29 |
51 |
17.47 |
29 |
21.28 |
80 |
9.05** |
|
Primary school |
57.14 |
120 |
53.61 |
89 |
55.59 |
209 |
||
|
Secondary and preparatory school |
18.57 |
39 |
27.11 |
45 |
22.34 |
84 |
||
|
Certificate/diploma and above |
0.00 |
0 |
1.81 |
3 |
0.80 |
3 |
||
|
Marital status of the respondents |
Married |
93.33 |
196 |
92.17 |
153 |
92.82 |
349 |
0.19 |
|
Divorce |
6.67 |
14 |
7.83 |
13 |
7.18 |
27 |
||
|
Household head's religion |
Protestant |
39.52 |
83 |
62.65 |
104 |
49.73 |
187 |
33.64*** |
|
Wakefata |
13.33 |
28 |
9.04 |
15 |
11.44 |
43 |
||
|
Muslim |
0.00 |
0 |
4.22 |
7 |
1.86 |
7 |
||
|
Orthodox |
47.14 |
99 |
24.10 |
40 |
36.97 |
139 |
||
*** = significant at p ≤ 1% level, ** = significant at p ≤ 5% level; Source: field survey, 2019.
Table 4: Descriptions of input supply for beef cattle production.
|
Inputs /variables |
Categories |
Percentage of household respondents in the two districts |
||||||
|
Toke Kutaye (N = 210 (55.85%)) |
BakoTibe (N = 166 (44.15%)) |
Total (N = 376 (100%)) |
X2-value |
|||||
|
N |
% |
N |
% |
N |
% |
|||
|
Type of feed resources used |
Pasture |
111 |
52.86 |
109 |
65.66 |
220 |
58.51 |
6.48* |
|
Forage |
12 |
5.71 |
8 |
4.82 |
20 |
5.32 |
||
|
Crop residue |
73 |
34.76 |
40 |
24.10 |
113 |
30.05 |
||
|
Concentrate |
14 |
6.67 |
9 |
5.42 |
23 |
6.12 |
||
|
Using Veterinary services |
No |
18 |
8.57 |
11 |
6.63 |
19 |
7.71 |
0.49 |
|
Yes |
192 |
91.43 |
155 |
93.37 |
347 |
92.29 |
||
|
Used/access to credit |
No |
183 |
87.14 |
133 |
80.12 |
316 |
84.04 |
3.41* |
|
Yes |
27 |
12.86 |
33 |
19.88 |
60 |
15.96 |
||
|
Type of cattle breed used |
Local breed |
178 |
84.76 |
161 |
96.99 |
339 |
90.16 |
33.16*** |
|
Cross breed |
0 |
0.00 |
5 |
3.01 |
5 |
1.33 |
||
|
Both breed |
32 |
15.24 |
0 |
0.00 |
32 |
8.51 |
||
*** = significant at p ≤ 1% level, * = significant at p ≤ 10% level; Source: field survey, 2019.
Supply of animals: The major suppliers of breeding stock in the study areas are farmers and NGOs. A majority (90.16%) of the cattle used by sampled household producers are the local breed that isused for traction purposes (Table 4). There is a significantdifference between the two districts at less than 1% significance level in case of the type of cattle breed used. The fattening exercise is undertaken mostly when the oxen are retired from farm work in order to replace them with younger animals.
Smallholder cattle producers and their functions
Producers rear cattle in order of their importance. In the study areas, the core functions of producers in the beef cattle value chain include the husbandry practices to produce the animal for traction purpose, milk purpose and fattening, mainly the old animals for the next core function in the value chain, i.e. marketing. Thus, their function includes feeding the animal, watering, provision of veterinary services and housing the animal for production.
Table 5: Description of beef cattle producers and their activities.
|
Producers’ activities /variables |
Categories |
Percentage of household respondents in the two districts |
||||||
|
Toke Kutaye (N = 210 (55.85%)) |
BakoTibe (N = 166 (44.15%)) |
Total (N = 376 (100%)) |
X2-value |
|||||
|
N |
% |
N |
% |
N |
% |
|||
|
Primary purpose of keeping cattle |
For milk |
85 |
40.48 |
50 |
30.12 |
135 |
35.90 |
18.04*** |
|
For meat |
10 |
4.76 |
26 |
15.66 |
36 |
9.57 |
||
|
For traction |
105 |
50.00 |
74 |
44.58 |
179 |
47.61 |
||
|
For selling |
10 |
4.76 |
16 |
9.64 |
26 |
6.91 |
||
|
Access to training/took training on cattle production, marketing and value addition |
No |
103 |
49.05 |
98 |
59.04 |
201 |
53.46 |
3.72* |
|
Yes |
107 |
50.95 |
68 |
40.96 |
175 |
46.54 |
||
|
Sources of producers’ market information |
Das |
15 |
7.14 |
12 |
7.23 |
27 |
7.18 |
3.95 |
|
Woreda administration |
0 |
0.00 |
3 |
1.81 |
3 |
0.80 |
||
|
Radio/TVs |
14 |
6.67 |
10 |
6.02 |
24 |
6.38 |
||
|
From market |
131 |
62.38 |
104 |
62.65 |
235 |
62.50 |
||
|
Trader |
50 |
23.81 |
37 |
22.29 |
87 |
23.14 |
||
|
Means of cattle transportation to the market |
Trek |
210 |
100 |
166 |
100 |
376 |
100 |
0.00 |
|
Truck |
0 |
0.00 |
0 |
0.00 |
0 |
0.00 |
||
|
Existence of appropriate trekking road and facilities in the market for transportation and selling. |
No |
171 |
81.43 |
147 |
88.55 |
318 |
84.57 |
3.61* |
|
Yes |
39 |
18.57 |
19 |
11.45 |
58 |
15.43 |
||
*** = significant at p ≤ 1% level, * = significant at p ≤ 10% level; Source: field survey, 2019.
Table 6: Description of beef cattle traders and their activities.
|
Traders’ activities /variables |
Categories |
Percentage of respondents in the two districts |
||||||
|
Toke Kutaye (N = 10 (50%)) |
BakoTibe (N = 10 (50%)) |
Total (N = 20 (100%)) |
X2-value |
|||||
|
N |
% |
N |
% |
N |
% |
|||
|
Cattle trading need a trading license? |
No |
0 |
0.00 |
7 |
70.00 |
7 |
35.00 |
10.77*** |
|
Yes |
10 |
100.00 |
3 |
30 |
13 |
65.00 |
||
|
Traders having trade license |
No |
8 |
80.00 |
8 |
80.00 |
16 |
80.00 |
0.00 |
|
Yes |
2 |
20.00 |
2 |
20.00 |
4 |
20.00 |
||
|
Is there a restriction on unlicensed cattle traders? |
No |
2 |
20.00 |
8 |
80.00 |
10 |
50.00 |
7.20*** |
|
Yes |
8 |
80.00 |
2 |
20.00 |
10 |
50.00 |
||
|
Sources of working capital in trading |
Own |
6 |
60.00 |
10 |
100.00 |
16 |
80.00 |
5.00** |
|
Loan |
4 |
40.00 |
0 |
0.00 |
4 |
20.00 |
||
|
If a loan, from whom traders borrow money? |
Family |
2 |
20.00 |
3 |
30.00 |
5 |
25.00 |
15.20*** |
|
Private money lender |
2 |
20.00 |
0 |
0.00 |
2 |
10.00 |
||
|
Friend/other traders |
0 |
0.00 |
7 |
70.00 |
7 |
35.00 |
||
|
Finance institution |
6 |
60.00 |
0 |
0.00 |
6 |
30.00 |
||
|
Mode of cattle transportation in trading |
Trek |
6 |
60.00 |
9 |
90.00 |
15 |
75.00 |
2.40* |
|
Truck |
4 |
40.00 |
1 |
10.00 |
5 |
25.00 |
||
|
In truck, is there appropriate place for uploading cattle? |
No |
10 |
100.00 |
10 |
100.00 |
20 |
100.00 |
0.00 |
|
Yes |
0 |
0.00 |
0 |
0.00 |
0 |
0.00 |
||
|
In trek, is there appropriate trekking road specific to cattle transportation? |
No |
10 |
100.00 |
6 |
60.00 |
16 |
80.00 |
5.00** |
|
Yes |
0 |
0.00 |
4 |
40.00 |
4 |
20.00 |
||
*** = significant at p ≤ 1%, ** = significant at p ≤ 5%, * = significant at p ≤ 10% level; Source: field survey, 2019.
The primary purpose of keeping livestock by producers: The (Table 5) below showed that cattle are primarily used for traction (47.61%) and milk purpose (35.90%). Meat production and selling are secondary, mainly old and unproductive animals. There is significant variation between the two districts at less than 1% significance level onthe primary purpose of keeping cattle by sampled household producers. Other study indicated that in the highland crop-livestock system cattle were used primarily for traction, with oxen making up 40-50% of the herd. In comparison, dairy/milking cows constitute 25% of the herd.
Access to training on cattle production, marketing and value addition: In the study areas, (Table 5) showed that, even though there was training for farmers on beef cattle production and marketing, but still more than half (53.46%) of sampled household producers were not took training or no access to training on cattle production, marketing and value addition. There is significantvariation at less than 10% significance level between the two districts on the access to training on beef cattle production and marketing in the study areas.
Sources of producers’ market information: About 62.50% of sampled household producers get market information from the market place that was mainly set by supply and demand of animals (Table 5). On sources of producers‘ market information, there is no significantdifference between the two districts.
Cattle transportation: The study results (Table 5) showed that means of cattle transportation to the market by household respondents was totally (100%) trekking that affectsthe quality of live animals, their product (meat) and by by-products (hide). According to Kano (2015), bodyweight loss, deterioration of body condition and death of animals were the major shortcomings of trekking. The same table showed that majority (84.57%) of sampled household respondents responded that there is no existence of appropriate trekking road and facilities in the market for transportation and selling, respectively.
Traders and their functions
Table 6 showed that the majority (65%) of the respondents agreed that cattle trading need a trading license, but about 80% of respondents have no trade license. Even though there is a restriction on unlicensed cattle traders, about half (50%) of respondents still responded that there is no restriction on unlicensed cattle traders that affect the activity of legal traders and revenue of the government. In case of both the need fora trade license and restriction of trading on unlicensed traders, there is a significantdifference at less than 1% significance level between the two districts. But, on having a trade license, there is no significantdifference between the two districts.
The results (Table 6) showed that about 80% of the respondents operate trading using their own capital sources and others (20%) receives a loan from friends, micro-finance institution, family and private money lenders. There is a significantdifference at less than 5% significance level between the two districts on sources of working capital in trading. Most of the time traders purchase cattle by themselves, and sometimes they use a broker/commission agent who facilitates simply buying and selling activities. Since there is no pricing system for livestock in the market, selling and buying price of the cattle mostly set by supply and demand and sometimes traders have more bargaining power due to access of market information than farmers in the study areas. The majority (75%) of the trader respondents use treks as a means of cattle transportation and others (25%) use truck during trading. In trucking, there is no appropriate place for uploading cattle and in trekking; there is no appropriate trekking road specific to cattle transportation in the study areas.
Consumers and their functions
Beef consumers are domestic consumers in the study areas who buy either processed beef from butchers or who, as a group, buy beef cattle to slaughter and then share the meat. Consumers may consume meat at the household (home) or away home. But, on the sources of beef, there is no significantdifference between the two districts. The consumers preferred the butcher to purchase meat for the following reasons: freshness, hygiene, safety, easy to access and fast. The families considered mostly the freshness and hygienic conditions when purchasing meat.
Value addition activities of the actors in beef cattle value chain
Value addition activities are those actions efficiently, effectively and directly related to increasing the value of beef cattle or beef as it proceeds through the various stages of production, marketing, processing and retailing of the product. In the case of the support functions, value addition activities are directly focused on supporting those actors and systems engaged in the production, marketing, processing and retailing of the product.
From the (Table 7), it is easy to understand that smallholder farmers produce cattle and supply it to the next stage without product differentiation and improving the existing production. Also, there is no farmers’ vertical expansion of farm operation through direct selling or move to on product processing that shortens the distance between farmer and consumer and is often a means to add value to the farm operation. If so doing these, the farmer can ask a higher price or gain increased market share. So, many intermediaries take the advantages of farmers without adding more value to the product and gain market shares.
Conclusions and Recommendations
The overall conclusion from the results was that beef cattle value chain actors in the study areas were input supplier, producer, trader, fattener, abattoir, hotel/restaurant, butcher, consumer, supporter and influencer organizations. Beef cattle production is traditional and not market-oriented. Producers sell their cattle when they are in need of cash. They also sell any cattle that happen to be available, rather than what the consumer demand. There is no formal livestock market information system that informs sample farmers which cattle are needed, who is the actual buyer and price for the different class of animals. The cattle supplied to the market were poor in body condition and old animal. The horizontal and vertical linkages of beef cattle value chain actors were weak, and there were little value addition activities by most of the chain actors. Lack of improved input (animal, forage), shortage of feed, lack of access to credit, transportation problem, lack of market infrastructure, the high price of animal and their product, multiple taxes, backyard slaughtering of cattle that was risky for consumers, unhygienic of meat from the abattoir (during transportation) and seasonality of meat demand were the major constraints hindering the development of beef cattle value chain in the study areas.In contrast, opportunities that enable the development of beef cattle value chain were suitable climate to develop forage and cattle production, high demand for the fattened animal, increasing demand for live animal and meat export, urbanization, high population and vicinity to the central market. Thus,the government should focus on the introduction of high
Table 7: Chain actors’ value addition activities and types of value-added in the study areas.
|
Chain actors |
Value addition activities |
Type of value added/created |
|
Producers |
Converting inputs into finished or semi-finished produce (beef cattle) |
Form |
|
Fattening (converting semi-finished produce into finished product), i.e. fattened beef cattle |
Form |
|
|
Transportation (provide cattle at a desired place and time) |
Place and Time |
|
|
Cost and risk holder |
Possession |
|
|
Traders |
Transportation (provide cattle at a desired place and time) |
Time and Place |
|
Cost and risk-taker |
Possession |
|
|
Fatteners |
Fattening (converting semi-finished produce into finished product), i.e. fattened cattle |
Form |
|
Cost and risk-taker |
Possession |
|
|
Transportation (provide animal at a desired place and time) |
Place and Time |
|
|
Abattoirs |
Processing (slaughter of cattle) |
Form |
|
Transport beef to the desired place and time |
Time and Place |
|
|
Butchers |
Processing (roasting, increases the usability of the product, i.e. cut beef into small pieces, deboning, packaging) |
Form |
|
Provide beef at a desired time and place |
Time and place |
|
|
Cost and risk holder |
Possession |
|
|
Hotels/restaurants |
Processing (slaughter of cattle, process beef into different food commodities) |
Form |
|
Provide food commodities at a desired time and place |
Time and place |
|
|
Cost and risk-taker |
Possession |
Source: field survey, 2019.
yielding improved forage crops adaptable to the area and improve the dissemination of improved forage technologies, their multiplication and distribution systems. Finally, creating strong horizontal and vertical linkage /relationships between the chain actors and do on mutually beneficial actions for the smallholder farmers.
Novelty Statement
The aim of the study was identifying actors of the beef cattle value chain and their value addition in the study area. Based on the data collected from 376 producers and 20 traders; totally 476 respondents by using interview schedule, site visit and personal observation.
Author’s Contribution
Fikiru Temesgen: Interpretation and data analysis
Debasa wakgari: Data collection and analysis.
Conflict of interest
The authors have declared no conflict of interest.
References
CSA, 2016. FAO Gender programmes: Food and Agriculture Organization of the United Nations. http://www.fao.org/gender-home/gender-programme/gender-livestock/jp/. Site visited on 20 August 2012.
IFAD, 2017. Value chains, linking producers to the markets. Livestock thematic papers. Tools for Project Design. http://www.ifad.org/lrkm/factsheet/valuechains.pdf.
Kanno, 2015. Livestock marketing, food security and related issues in Ethiopia, A paper prepared for the workshop on “Towards Sustainable Food Security in Ethiopia: Integrating the Agri-food Chain” held at Ghion Hotel, Addis Ababa, Ethiopia, 15-16 May 2003.
LMD, 2018. Value chains: Linking producers to the markets. Rome, Italy: International Fund for Agricultural Development
Samuel, 2016. Livestock marketing in Kenya-Ethiopia Border Areas: A baseline study humanitarian policy group working paper. Overseas Development Institute www.odi.org.uk/hpg accessed on October 28 2010.
Solomon, D., B. Derek, A. Samuel and G. Sintayehu. 2015. Diagnostic study of live cattle and beef production and marketing: Constraints and opportunities for enhancing the systemtosunet, 2018. Competitive advantage, creating and sustaining superior performance. New York, USA: The Free Press.
Yamane, T., 1967. Statistics: An introductory analysis, 2nd ed. Harper and Row. New York.
To share on other social networks, click on any share button. What are these?


