View larger version:
Download Original File
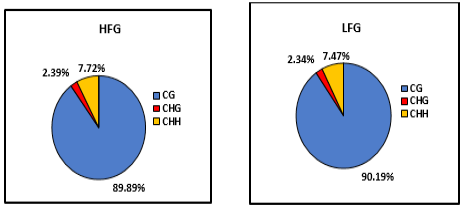
Figure 1
Pie charts of the distribution ratios of methylated C in the three contexts