View larger version:
Download Original File
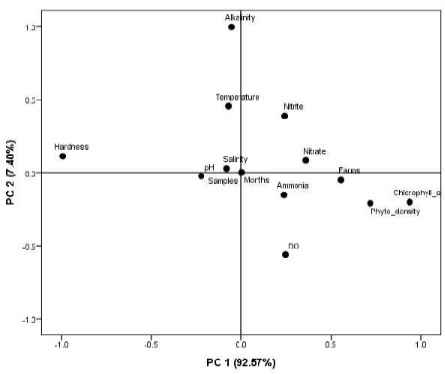
Figure 2:
Principal component plot of water quality variables during the study period.