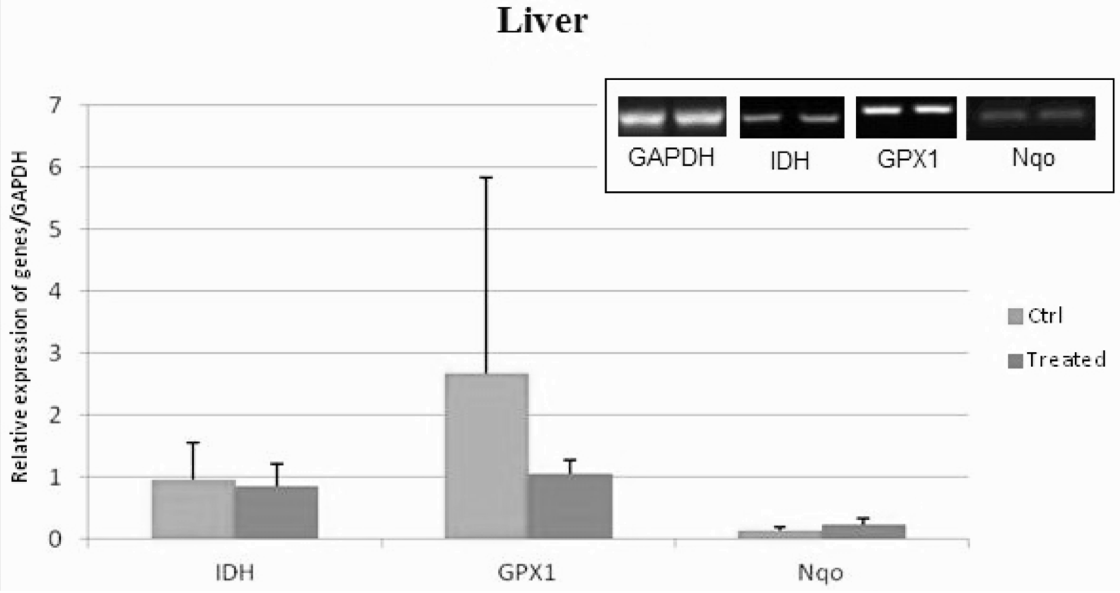
Fig. 2.
Bar diagram and representing gels showing RT-PCR gene expression analysis of the oxidative stress genes, NAD(P)H quinone dehydrogenase 1 (Nqo1), Glutathione peroxidase (Gpx1) and Isocitrate dehydrogenase-1 (Idh1) in the liver tissue after doxorubicin treatment in SD rats. Data are expressed as the means ± standard error of the mean as analyzed by Student’s t-test; the level of significance is p< 0.05.