
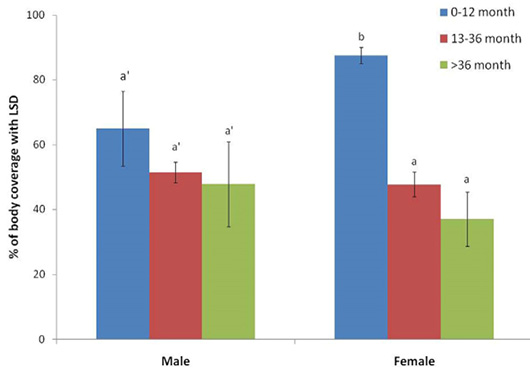
Figure 3:
Average body surface coverage with skin nodules of different age categories of male and female cattle under study area. The data are presented as the mean ± SEM. Bars with different letters within the respective endpoint differ from each other statistically significant (p< 0.05).