
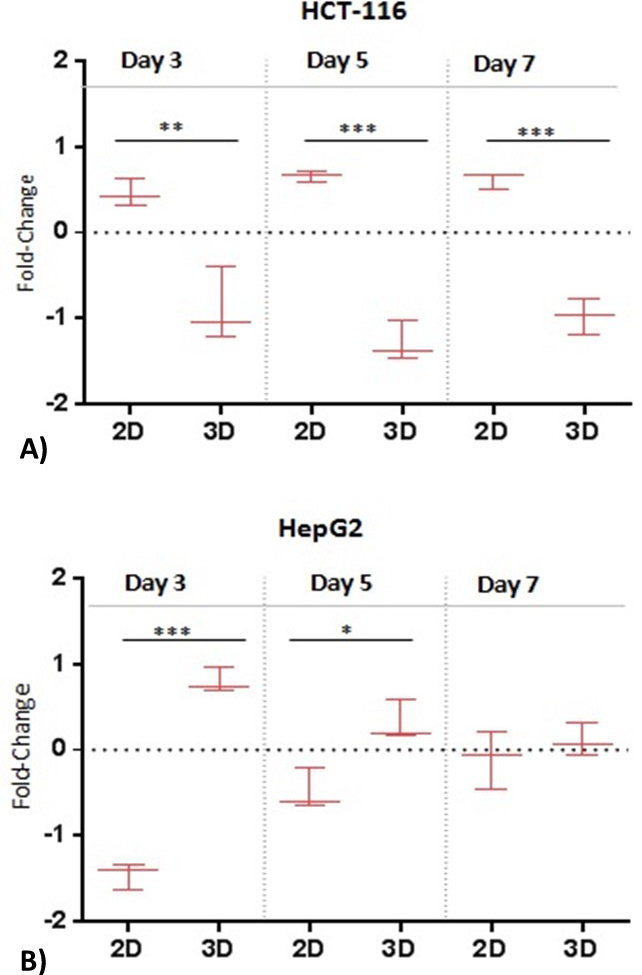
Fig. 1.
Comparison of proliferation rates in 2D and 3D cell culture systems. (A) HCT-116 and (B) HepG2 cells were cultivated (seeding density; 3x10⁴ cells) in 2D and 3D cell culture systems for 3, 5 or 7 days. At each time point DNA/protein quantification assays were performed to determine cell number. Data were median normalized and LOG2 transformed. Data are representative of three independent experiments. Significance was determined by unpaired t-test. *Significantly different (*p ≤ 0,05; **p ≤ 0,01; ***p≤ 0,001), n.s not significant (p > 0,05).