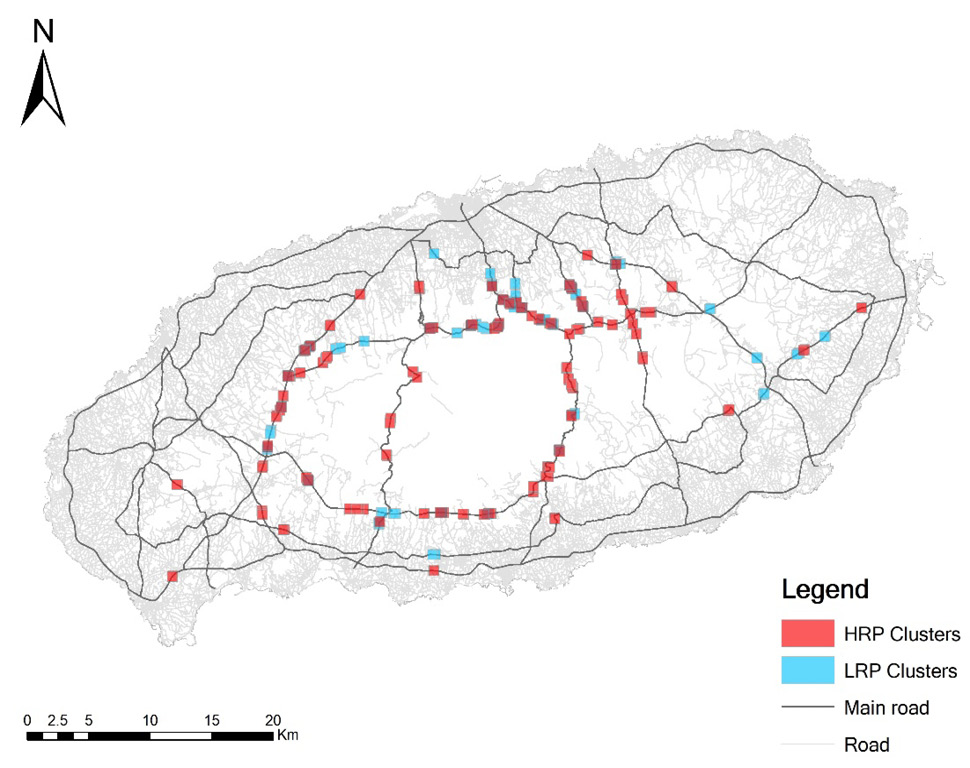
Fig. 4.
Distribution of roe deer vehicle collision (RDVC) clusters generated using the KDE+ method with data from the main road. Red and blue quadrangles indicate high risk period (HRP) and low risk period (LRP), respectively.
Distribution of roe deer vehicle collision (RDVC) clusters generated using the KDE+ method with data from the main road. Red and blue quadrangles indicate high risk period (HRP) and low risk period (LRP), respectively.