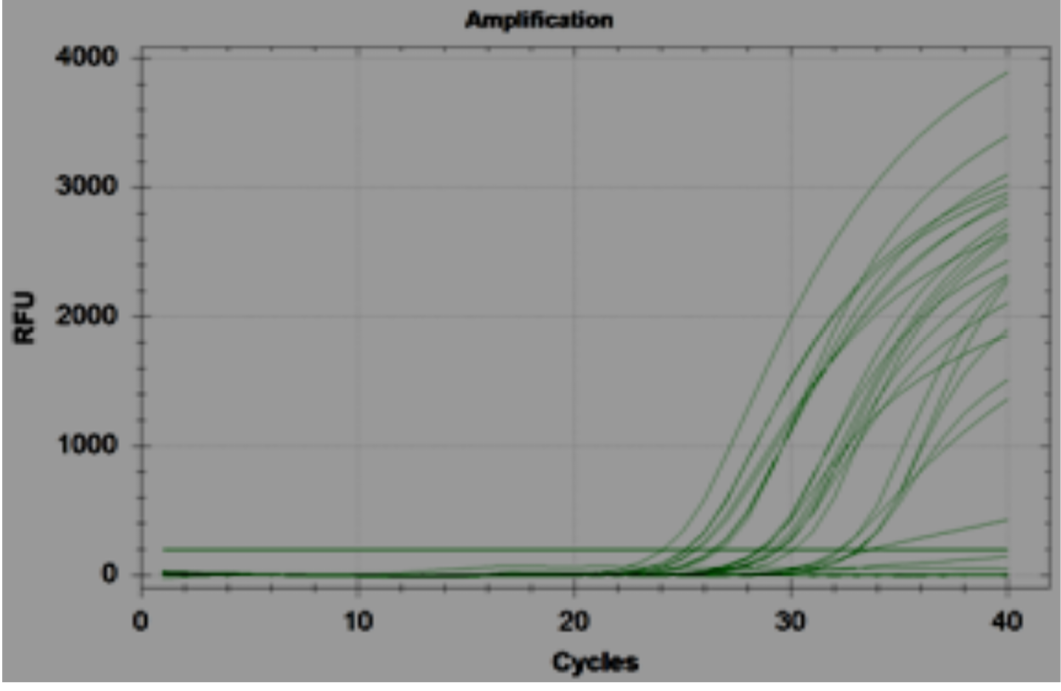
Figure 1
Plate showing PCR result. The positive control quantified at 22 cycle. The graph represents the quantification cycles of samples with respect to positive and negative control. The earlier the quantification cycle comes the more is the infection.