View larger version:
Download Original File
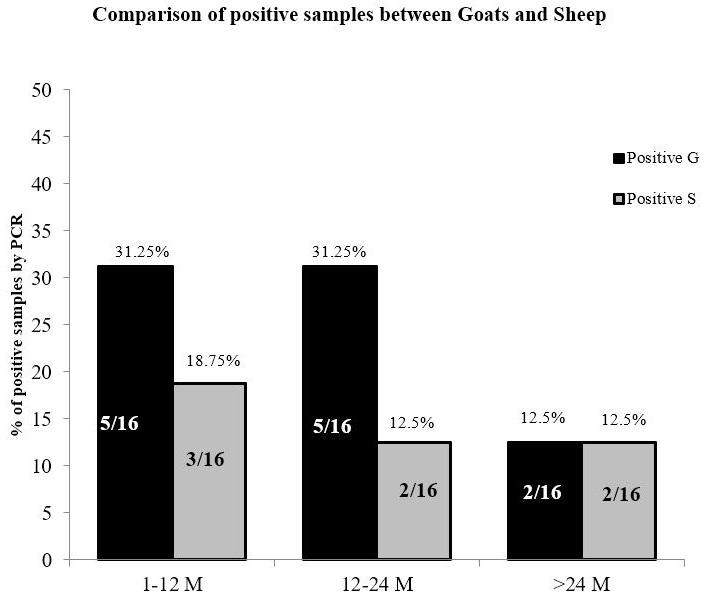
Figure 2
Comparison of PCR positive sheep and goats with Bar chart.