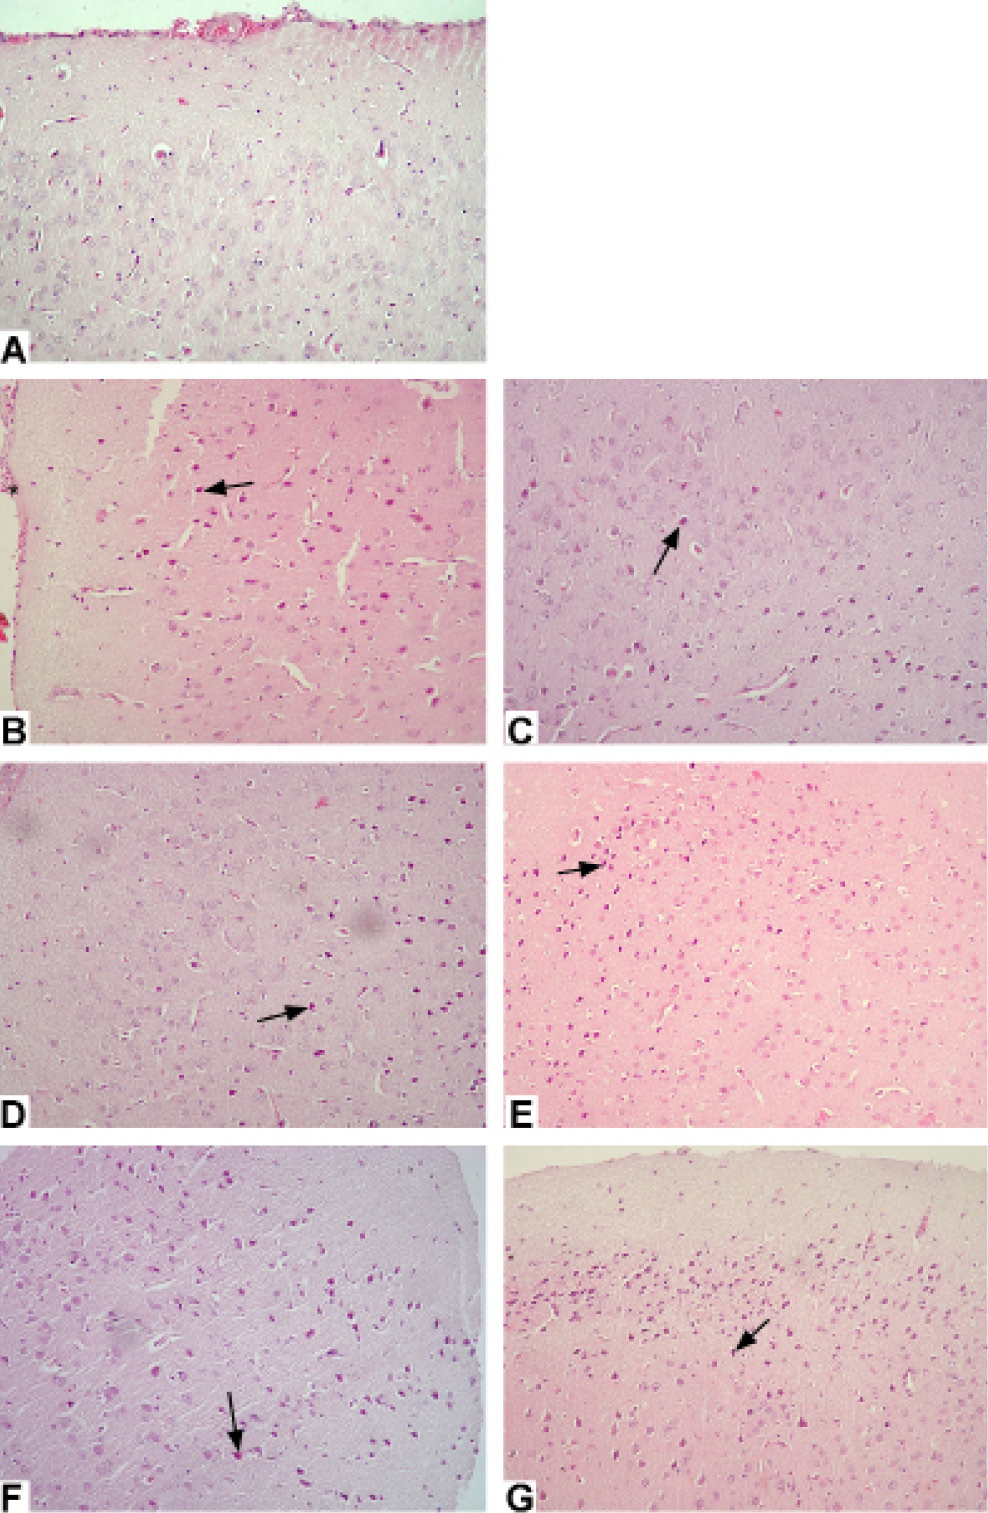
Fig. 7.
Representative photomicrographs of cerebral cortex in experimental groups: Normal morphology of cerebral cortex in control group (A); vascular congestion (*) and degenerated neurons (arrow) in CRF group (D); decreased number of degenerated neurons (arrow) in CRF+CAP (C), CRF+VAL (D), CRF+NAC (E), CRF+CAP+NAC (F) and CRF+VAL+NAC (G) groups are seen. H andE staining, original magnifications: 200x.