
Figure 4
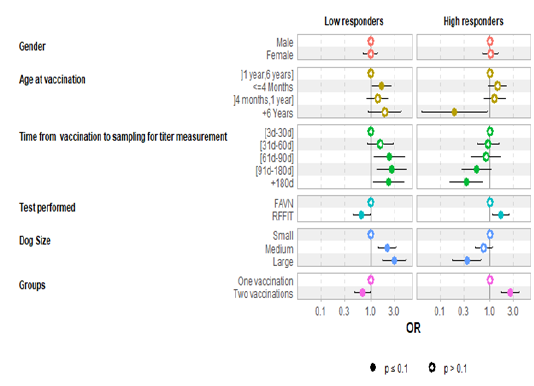
Graphical representation of the odds ratios showing the effect of different factors using the “ggcoef_multinom” library in R
Graphical representation of the odds ratios showing the effect of different factors using the “ggcoef_multinom” library in R