Figure 1
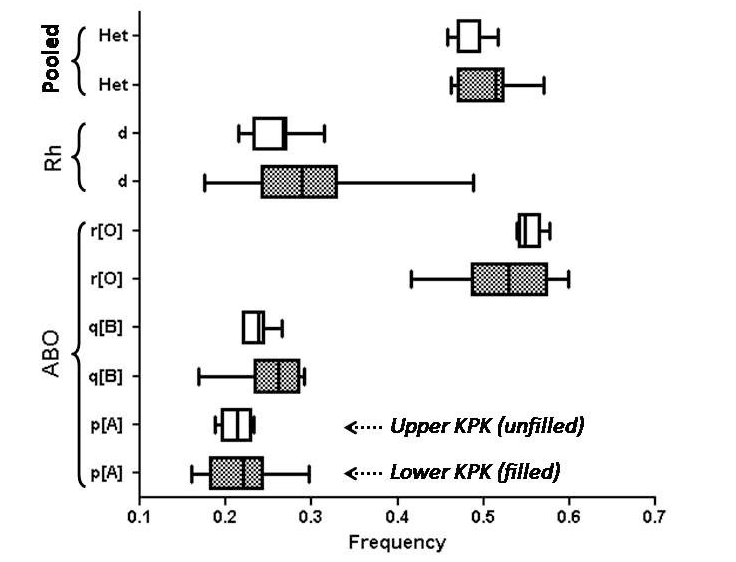
Box-and-whisker plots showing the range of allelic frequencies and heterozygosities (Het) between populations of lower KPK (filled boxes) and upper KPK (unfilled boxes).
Box-and-whisker plots showing the range of allelic frequencies and heterozygosities (Het) between populations of lower KPK (filled boxes) and upper KPK (unfilled boxes).