Fig. 1.
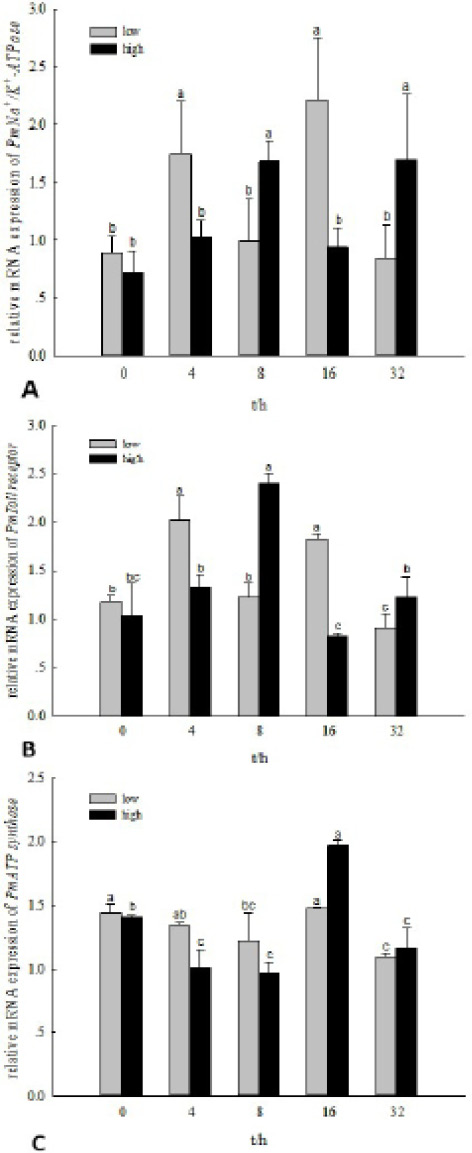
Relative expression levels of PmNa+-K+-ATPase (A), PmToll receptor (B) and PmATP synthase (C) after salinity challenge.
Relative expression levels of PmNa+-K+-ATPase (A), PmToll receptor (B) and PmATP synthase (C) after salinity challenge.