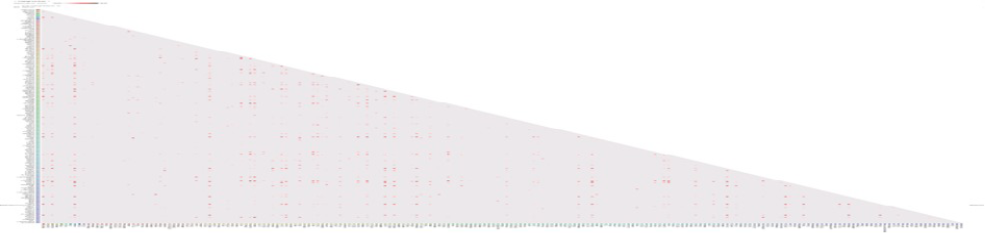
Figure 2
Co-expressed genes in the dataset. The paler red color represent the less co-expressed genes, the dark red color shows the genes are more co-expressed.
Co-expressed genes in the dataset. The paler red color represent the less co-expressed genes, the dark red color shows the genes are more co-expressed.