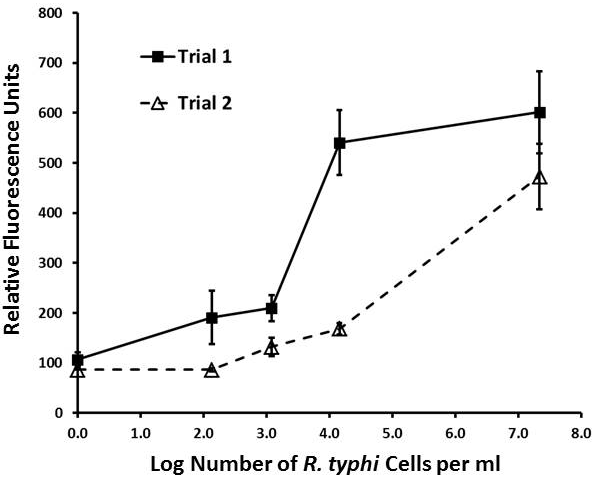
Figure 3
Titration results for 2 separate trials for the lyophilized homogeneous Rt-18R fluorescent aptamer-magnetic bead sandwich assay (combination 5 in Figure. 2) versus the concentration of R. typhi cells shown. Means and standard deviations of 3 readings are shown for each data point.