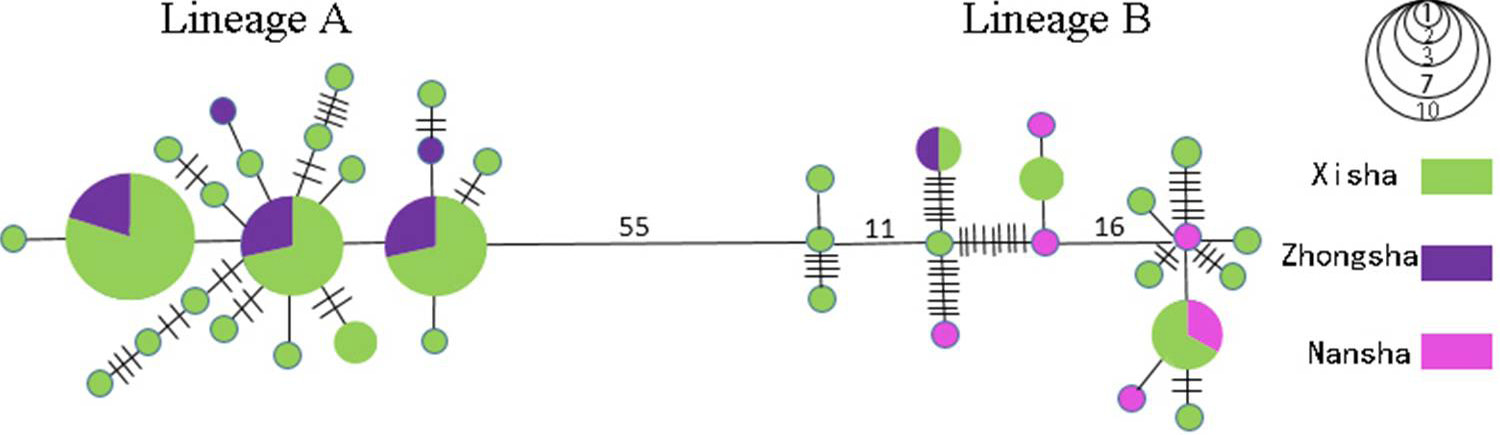
Fig. 2.
Unrooted minimum spanning trees showing genetic relationship among control region haplotypes for L. olivaceus. The sizes of circles are proportional to haplotype frequencies. Perpendicular tick marks and numbers on the lines joining haplotypes represent the number of nucleotide substitutions.