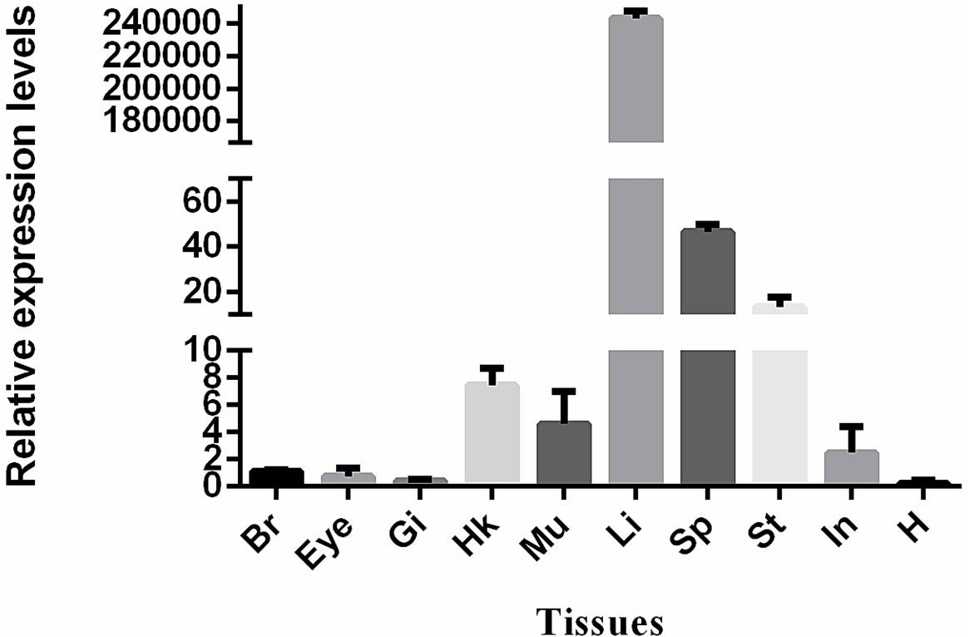
Fig. 6.
Relative expressions of L-FABP in different brain (Br), gills (Gi), head-kidney (Hk), spleen (Sp), eye (Eye), intestine (In), stomach (St), liver (Li), muscle (Mu) and heart (H), by quantitative RT-PCR analysis. Each Bar represent the mean ± SD (n=3). Different lowercase letters indicate statistically significant differences (P<0.05).