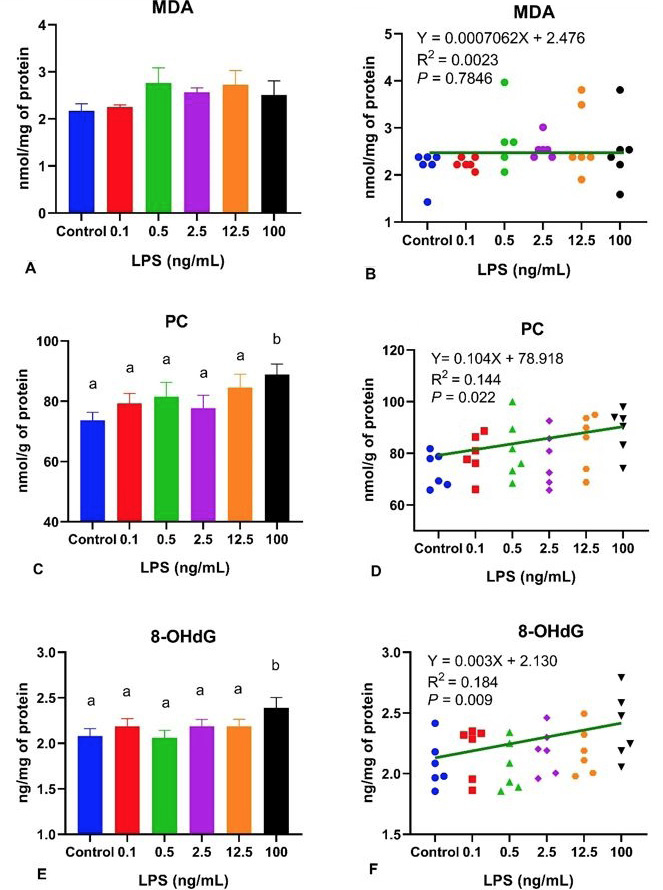
Fig. 3.
Effects of different LPS levels on oxidative damage markers’ concentrations (A, C, and E), and the correlation between LPS and markers’ levels (B, D, and F) in MAC-T cells. Columns without a common lowercase letter (a, b) indicate significant difference among treatments (P < 0.05). MDA, malondialdehyde; PC, protein carbonyl; 8-OHdG, 8-hydroxy-2’-deoxyguanosine.
