
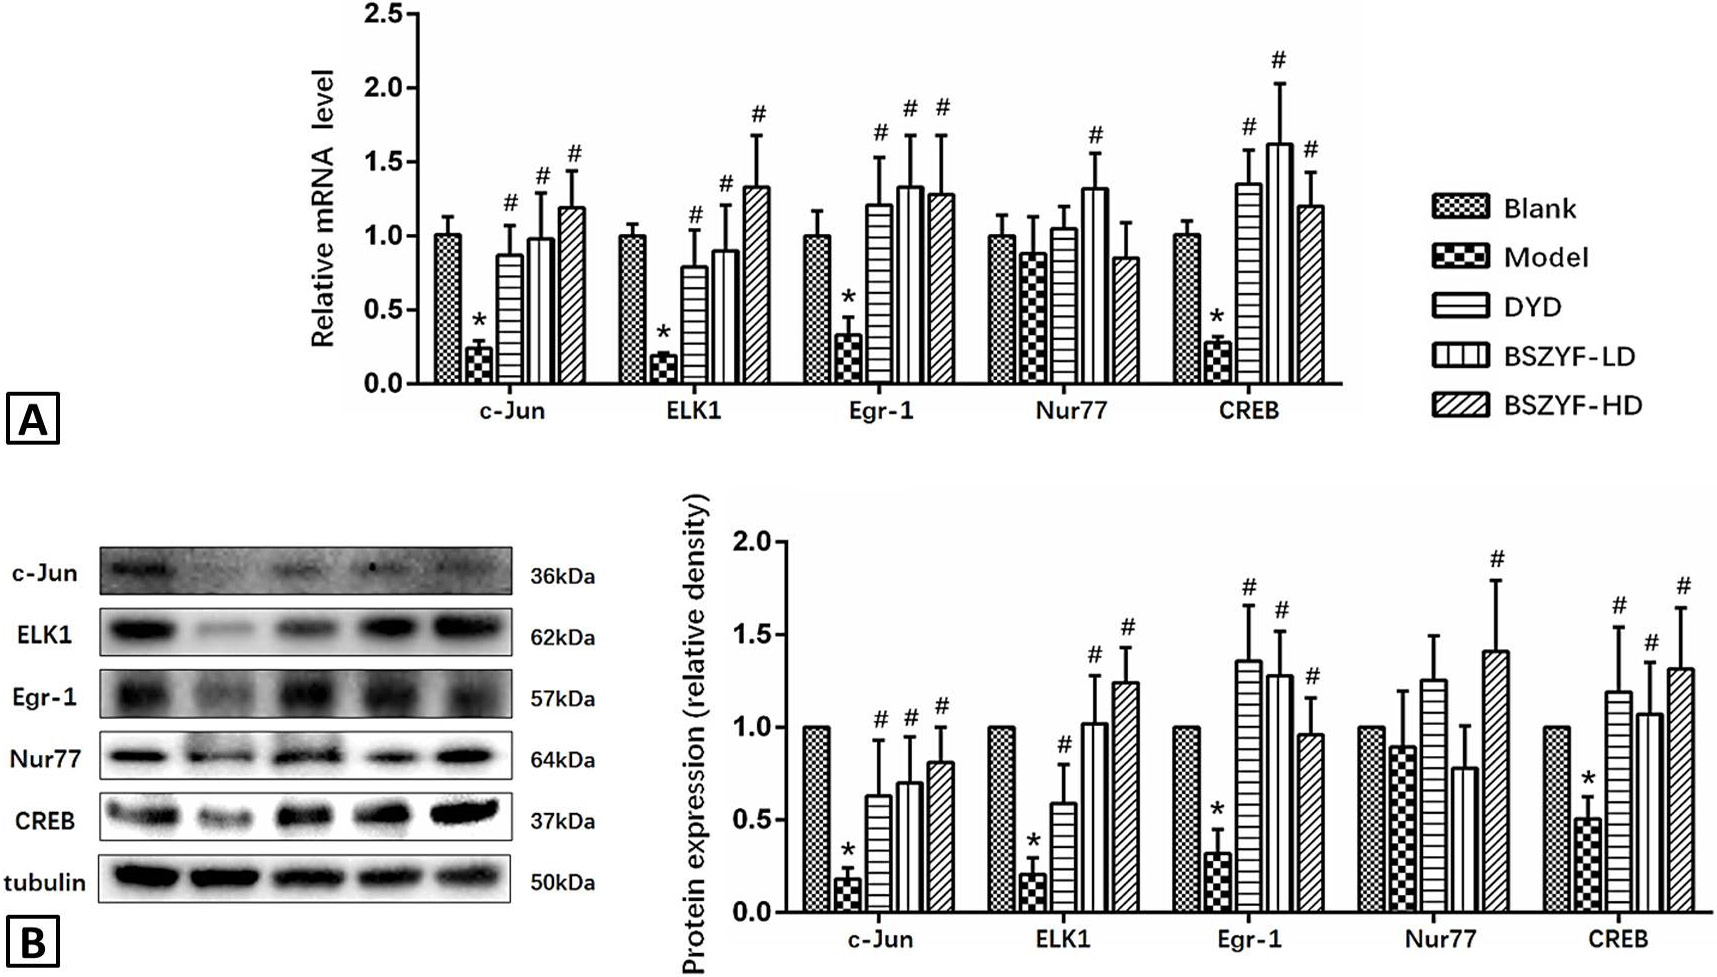
Fig. 4.
BSZYF treatment promoted the activation of transcription factors c-Jun, ELK-1, Egr-1, and CREB. A, the mRNA expression of transcription factors was analyzed by qPCR. B, Western blotting to measure the protein expression of transcription factors. The relative density was quantified relative to tubulin. Values are represented as mean±SD (n=6 per group), *P<0.05 compared with the blank group, #P<0.05 compared with the model group.