
Fig 4
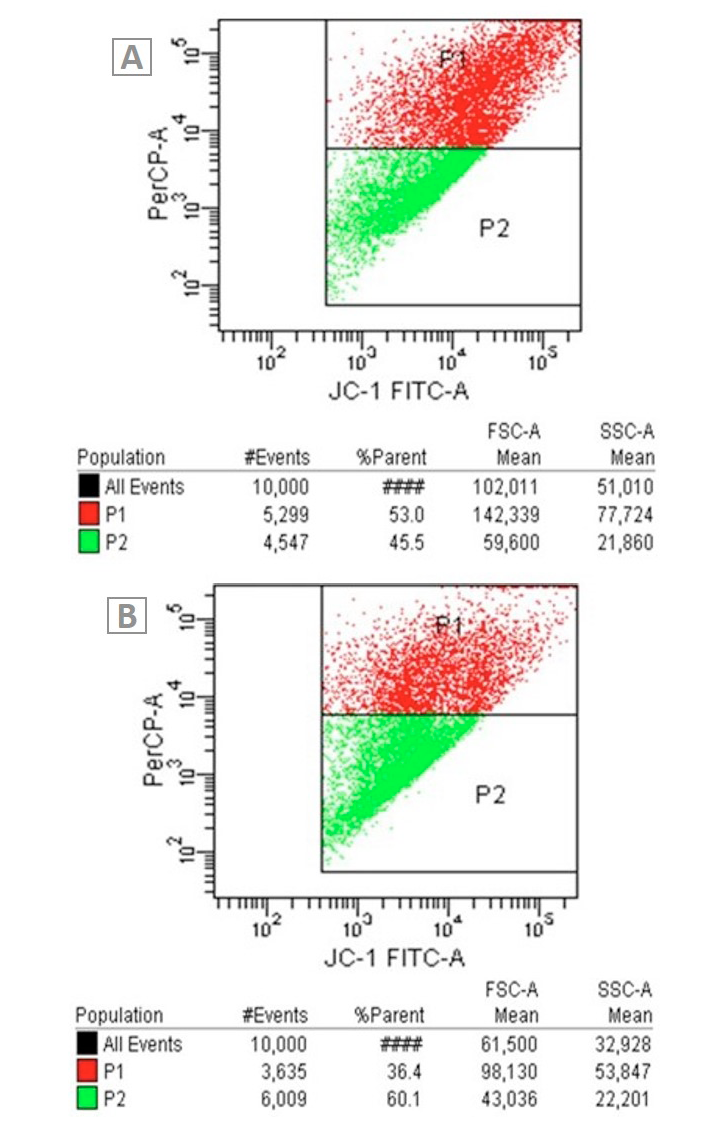
Mitochondrial membrane potential changes of A549 cells. A, Untreated A549 cells: B, A549 cells exposed to ceranib-2.
Mitochondrial membrane potential changes of A549 cells. A, Untreated A549 cells: B, A549 cells exposed to ceranib-2.