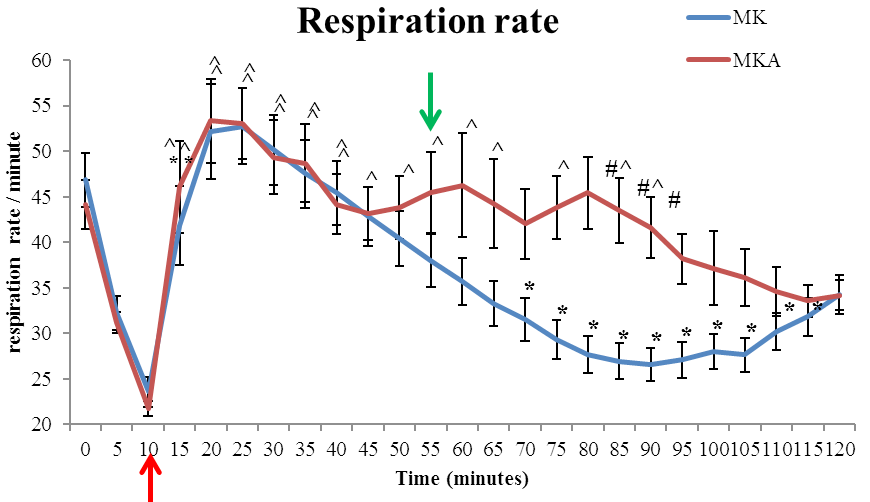
Fig. 2.
Respiratory rate (Mean ± SE) following MK and MKA treatment in a crossover design using 12 pigeons. For other details see Figure 1.
Respiratory rate (Mean ± SE) following MK and MKA treatment in a crossover design using 12 pigeons. For other details see Figure 1.