
Figure 3
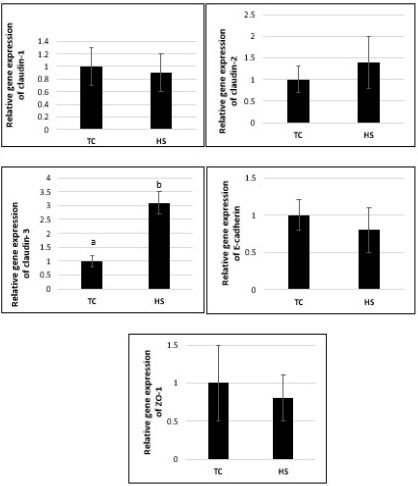
mRNA expression levels of tight junction genes in the ceca of chickens. Amplifications were performed on twenty-five independent samples with triplicate reactions carried out for each sample. The relative mRNA level was calculated using the 2−ΔΔCt method. All data are represented as the mean ± SE. Different letters in the upper of columns represent significantly different (p < 0.05) by unpaired t-test.