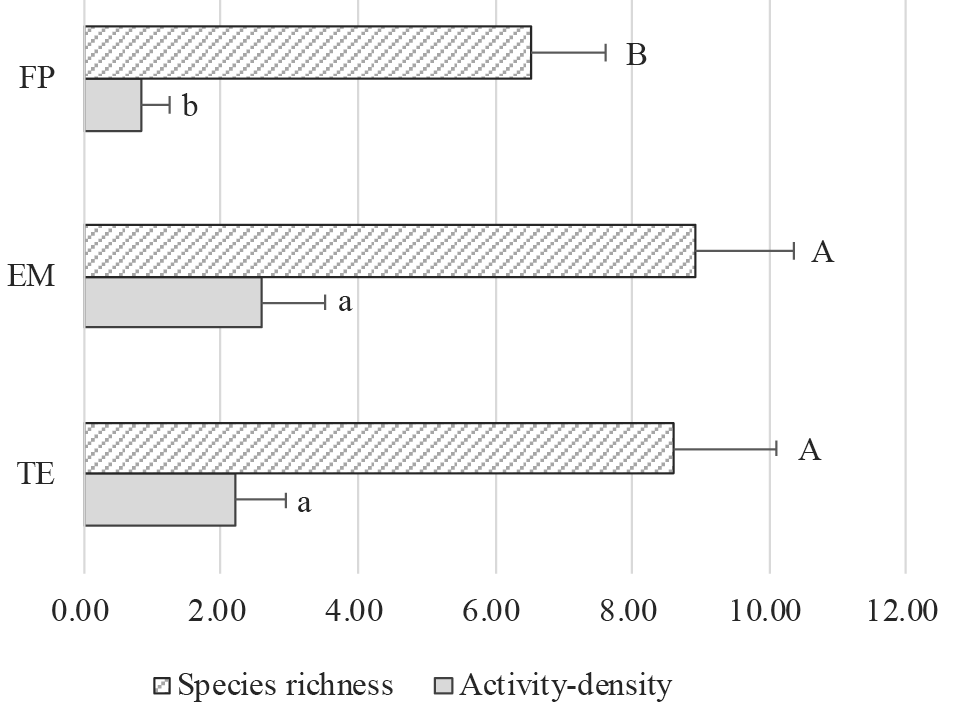
Fig. 4.
Spatial dynamics of carabid beetle activity density and species richness in different management regimes; ANOVA was used to compare differences among different interference levels. Different letters on the same type of bar indicate significant differences at the P < 0.05 level.