View larger version:
Download Original File
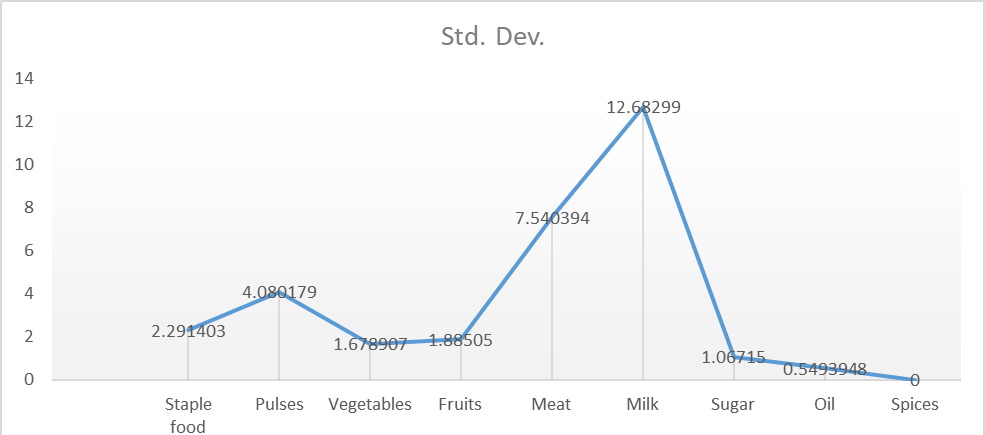
Figure 2:
Graphical presentation of Standard deviation of nine food groups.