Fig 1
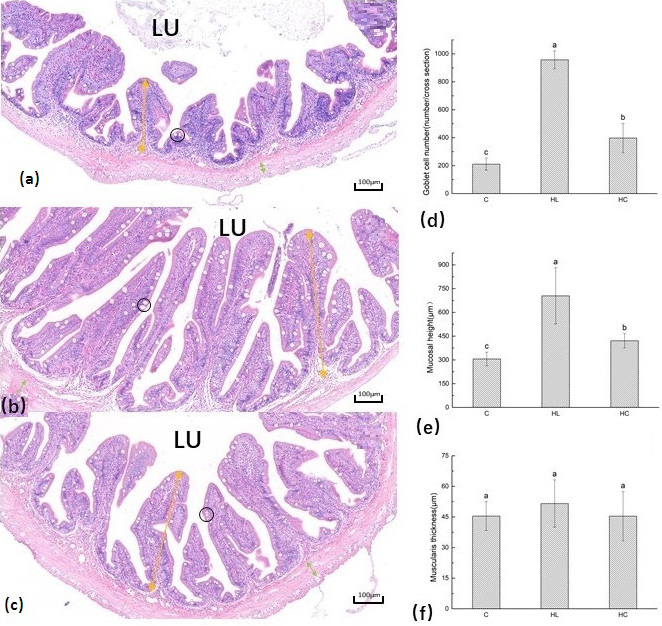
The gastrointestinal tract of barramundi is influenced by different diets. Representative foregut histological sections (20×magnification) are shown on the left (Panels a–C; b–HL; c–HC). Circle indicate the location of goblet cell; Yellow double-arrow line segments indicate the height of the mucosa; green double-arrow line segments indicate muscularis thickness; LU: lumen. Average activity of goblet cell number (Panel d), mucosal height (Panel e) and were muscular thickness (Panel f) measured from sections of the foregut barramundi fed experimental diet (C, HL, HC). Different superscript letters indicate significant differences among treatments (P<0.05). Error bars represent standard error.