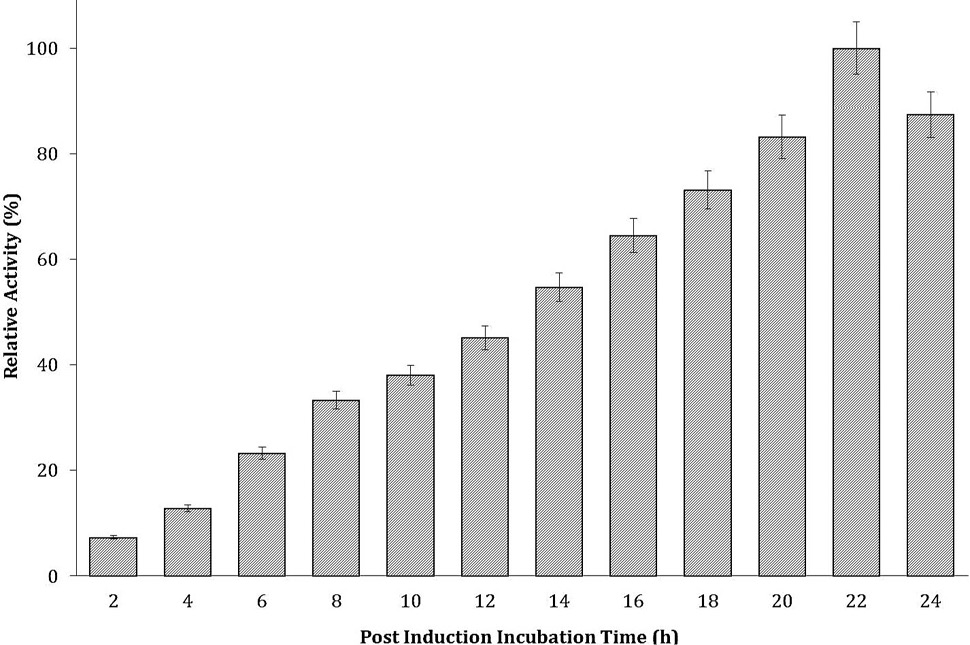
Fig. 3.
Effect of post induction incubation time on recombinant cellulase production. Experiment was conducted at 25°C. The data on X-axis shows the post induction incubation time (h) and Y-axis shows the relative activity (%).
Effect of post induction incubation time on recombinant cellulase production. Experiment was conducted at 25°C. The data on X-axis shows the post induction incubation time (h) and Y-axis shows the relative activity (%).