
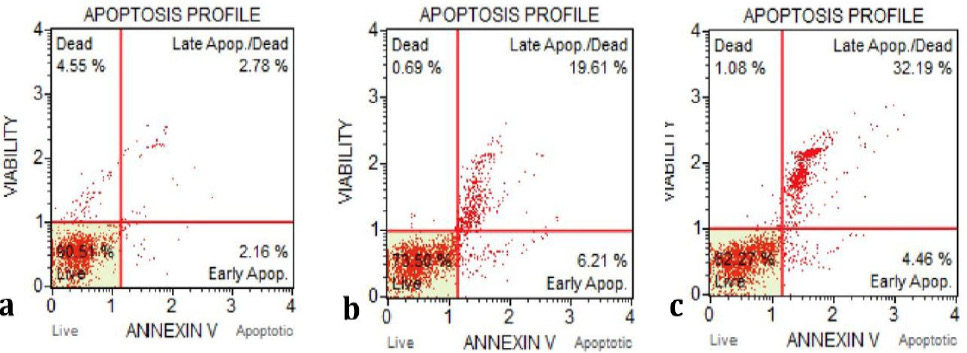
Apoptosis profiles of untreated A549 cells (a) and A549 cells treated with IC50 values of silymarin (b) and silymarin-loaded SLN for 24 h (c). Apoptosis profiles of A549 control cells (a) showed 90.51% live, 2.16% early and 2.78% late apoptotic cells. In this group of cells percentage of dead cells was detected to be 4.55%. A549 cells treated with IC50 concentration of silymarin (b) percentage of live cells was detected 73.50. Early apoptotic and late apoptotic cells of this group were 6.21% and 19.61%, respectively. A negligible percentage (0.69%) of the same group of A549 cells were dead. Total percentage of cells that underwent apoptosis was 36.75 of that 32.19% were in late apoptosis in silymarin-loaded SLN treated A549 cells (c). The percentage of live cells in the same group was detected to 62.27 for 24 h.