
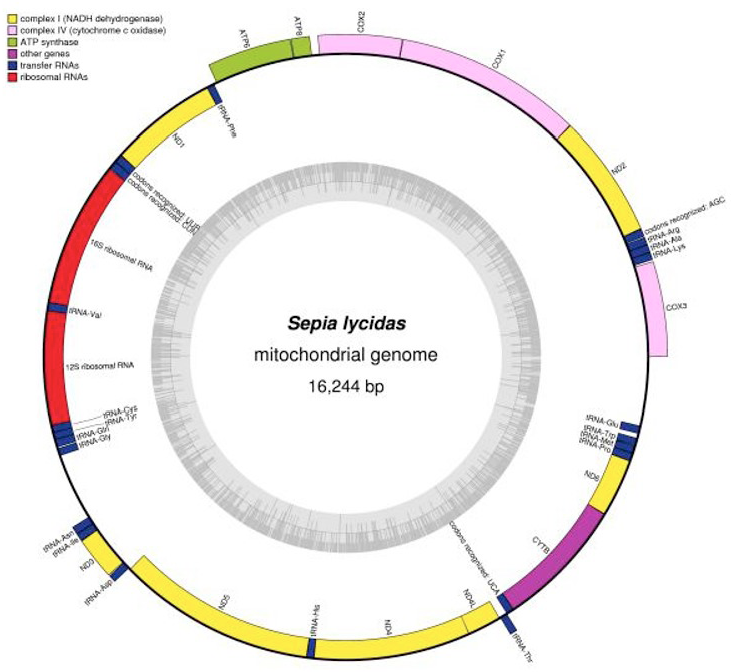
Fig. 1.
Gene map of S. lycidas mitochondrial genome. Genes encoded on the heavy or light strands are shown outside or inside the circular gene map, respectively. The inner ring indicates the GC content. The figure was initially generated with Organellar Genome DRAW (OGDRAW) and modified manually.