Figure 3
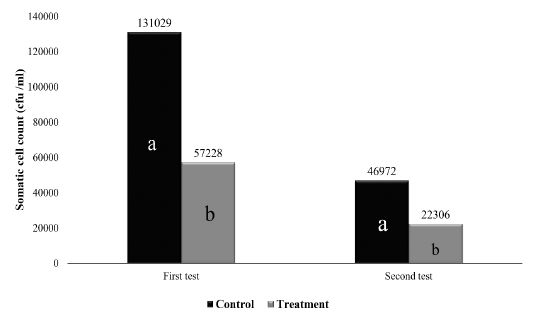
Effect of potassium carbonate on somatic cell count (cfu/ml) in milk for control and treatment groups at two times. Superscript letters (a, b) show significant difference between control and treatment groups (P 0.05).
Effect of potassium carbonate on somatic cell count (cfu/ml) in milk for control and treatment groups at two times. Superscript letters (a, b) show significant difference between control and treatment groups (P 0.05).