
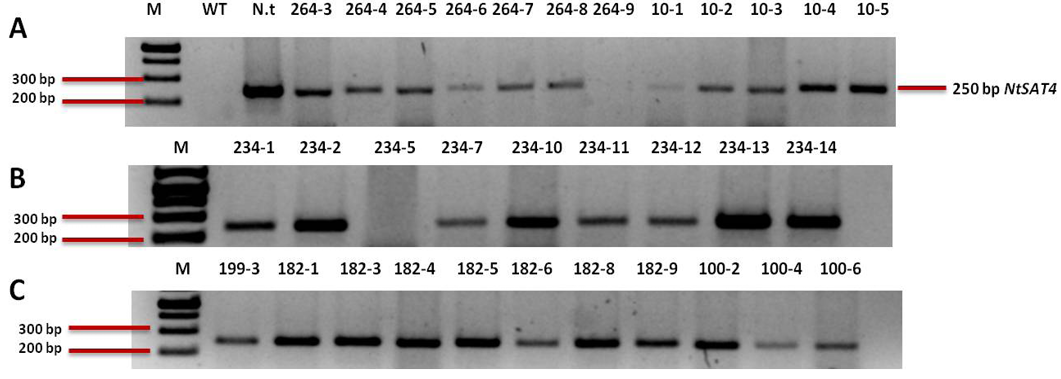
Figure 8
Analysis of gDNA PCR for the F2 transgenic samples run on 1.5 % agarose; Lanes; M: 1kb plus ladder; WT: B. napus wild-type (negative control); N.t: Nicotiana tabacum wild-type (positive control); Agarose gels result show the ands for samples corresponding to different compartments; A: cytosolic lines gDNA samples; B: Plastidic lines; C: Mitochondrial lines.