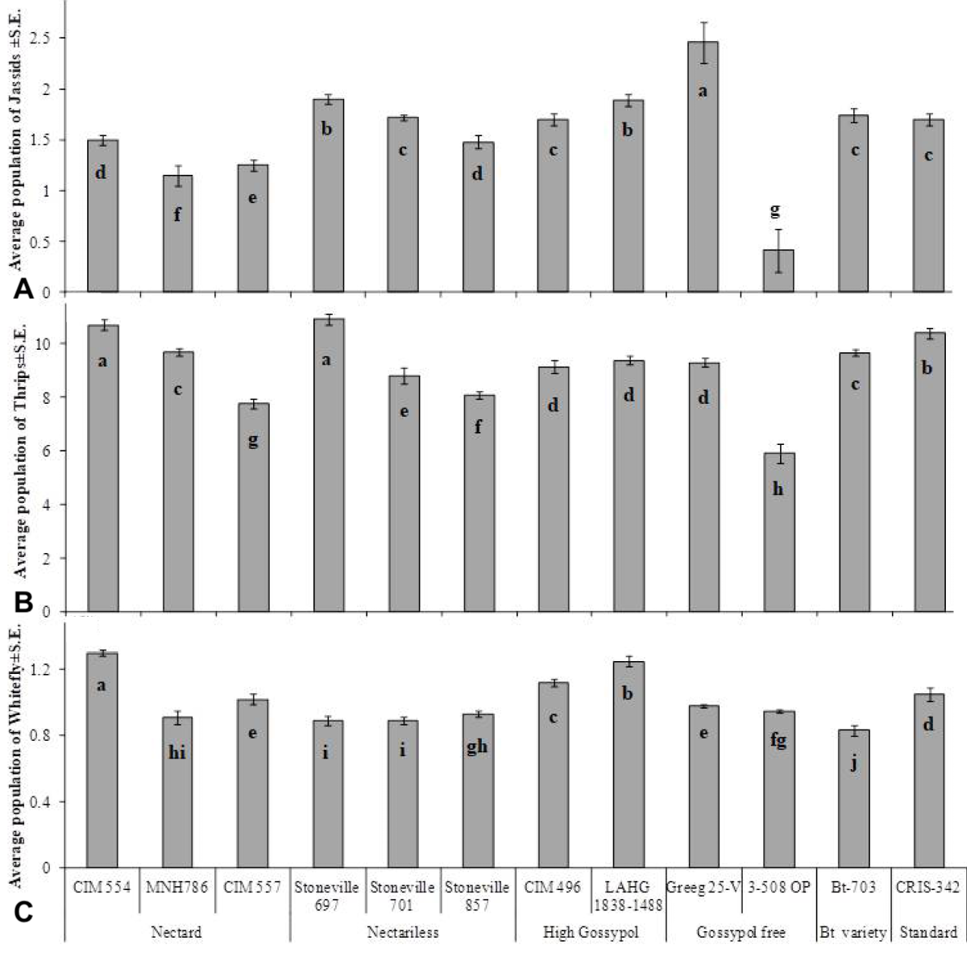
Fig. 2.
Average population of jassids (A), thrips (B) and whitefly (C) on different cotton varieties. Means were compared by Duncan Multiple Range (DMR) test. Alphabets on bars indicate the level of significance. Number sharing similar letters in column are not significantly different by DMR Test at P = 0.05.