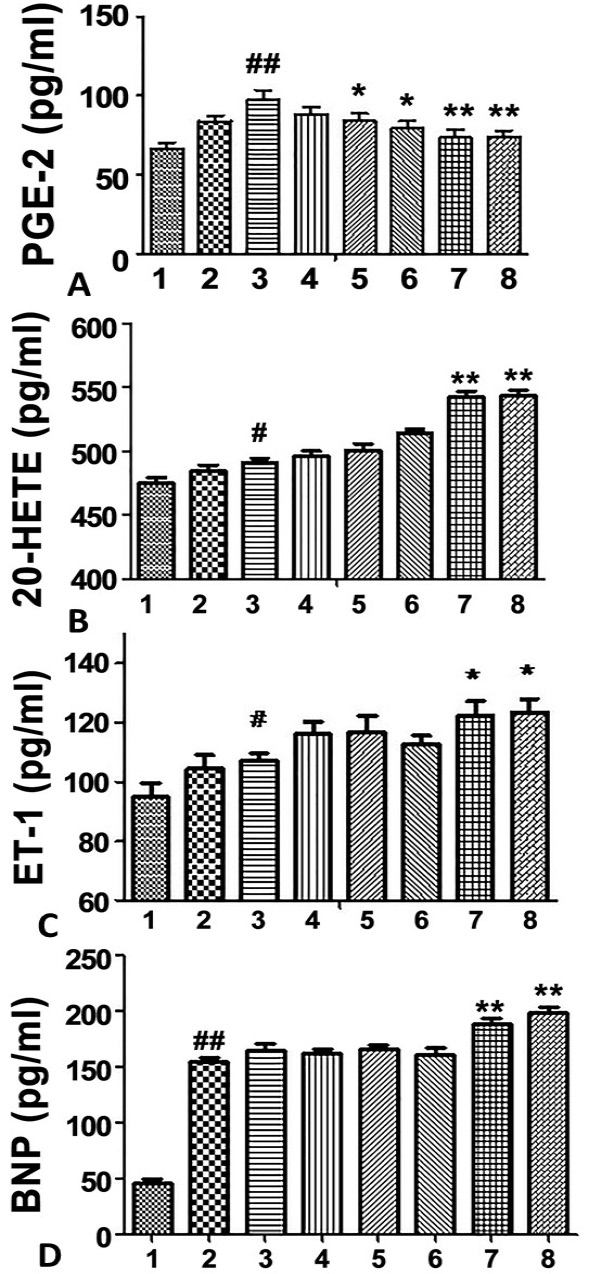
Fig. 3.
Effects of drug-combination on the PGE-2 (A), 20-HETE (B), ET-1 (C) and BNP (D) levels in the experimental groups. Data are the mean ± SD. #P<0.05, ##P<0.01 compare with control group; *P<0.05, **P<0.01 compare with model group.
Effects of drug-combination on the PGE-2 (A), 20-HETE (B), ET-1 (C) and BNP (D) levels in the experimental groups. Data are the mean ± SD. #P<0.05, ##P<0.01 compare with control group; *P<0.05, **P<0.01 compare with model group.