
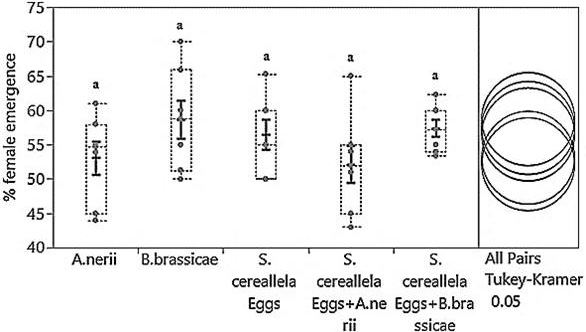
Fig. 7.
Percent female emergence of C. carnea is presented in this graph when provided with different larval preys. Black dots are denoting the values of female emergence. The dotted line is presenting box plots and displaying means female emergence in response to various larval preys. All black solid vertical lines in box plots indicate ± SEM. Black circles at right, are presenting the treatment mean comparisons by using Tukey HSD.