Figure 2:
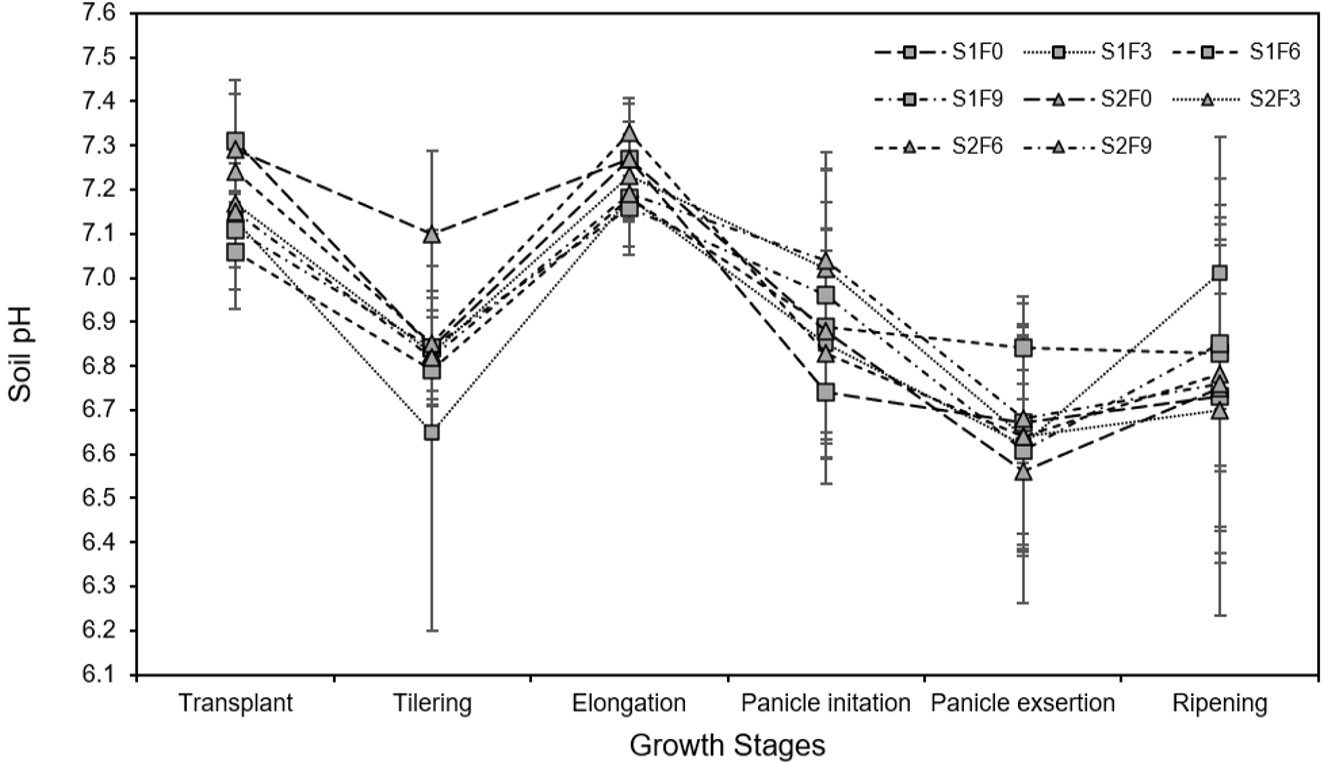
Soil pH in the rice growth stages. Error bars represent standard deviation of three samples. S1 = grid, S2 = Jarwo 2: 1, F0 = 0 ton ha-1, F3 = 3 ton ha-1, F6 = 6 ton ha-1, F9 = 9 ton ha-1.
Soil pH in the rice growth stages. Error bars represent standard deviation of three samples. S1 = grid, S2 = Jarwo 2: 1, F0 = 0 ton ha-1, F3 = 3 ton ha-1, F6 = 6 ton ha-1, F9 = 9 ton ha-1.