
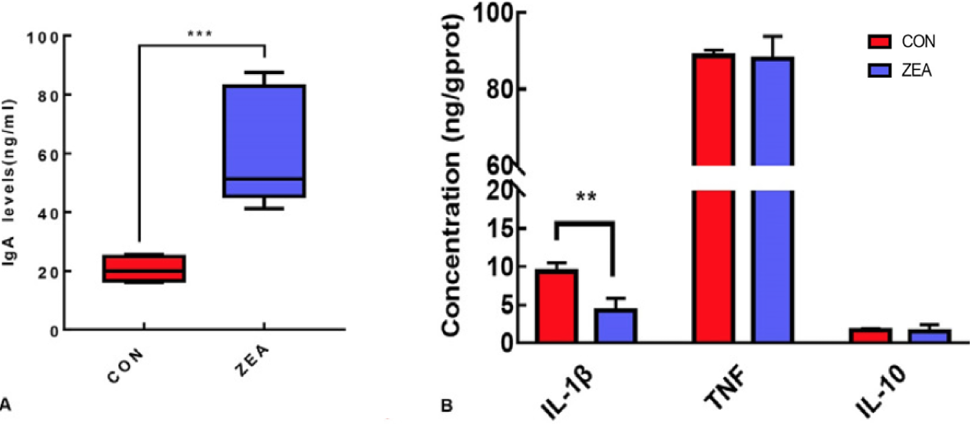
Fig. 4.
(A), Changes in the sIgA levels in the colonic faeces. (B), Changes in the cytokines in the colon. All the data are expressed as the means ± SEM. **: P value<0.01, ***: P value<0.001.
(A), Changes in the sIgA levels in the colonic faeces. (B), Changes in the cytokines in the colon. All the data are expressed as the means ± SEM. **: P value<0.01, ***: P value<0.001.