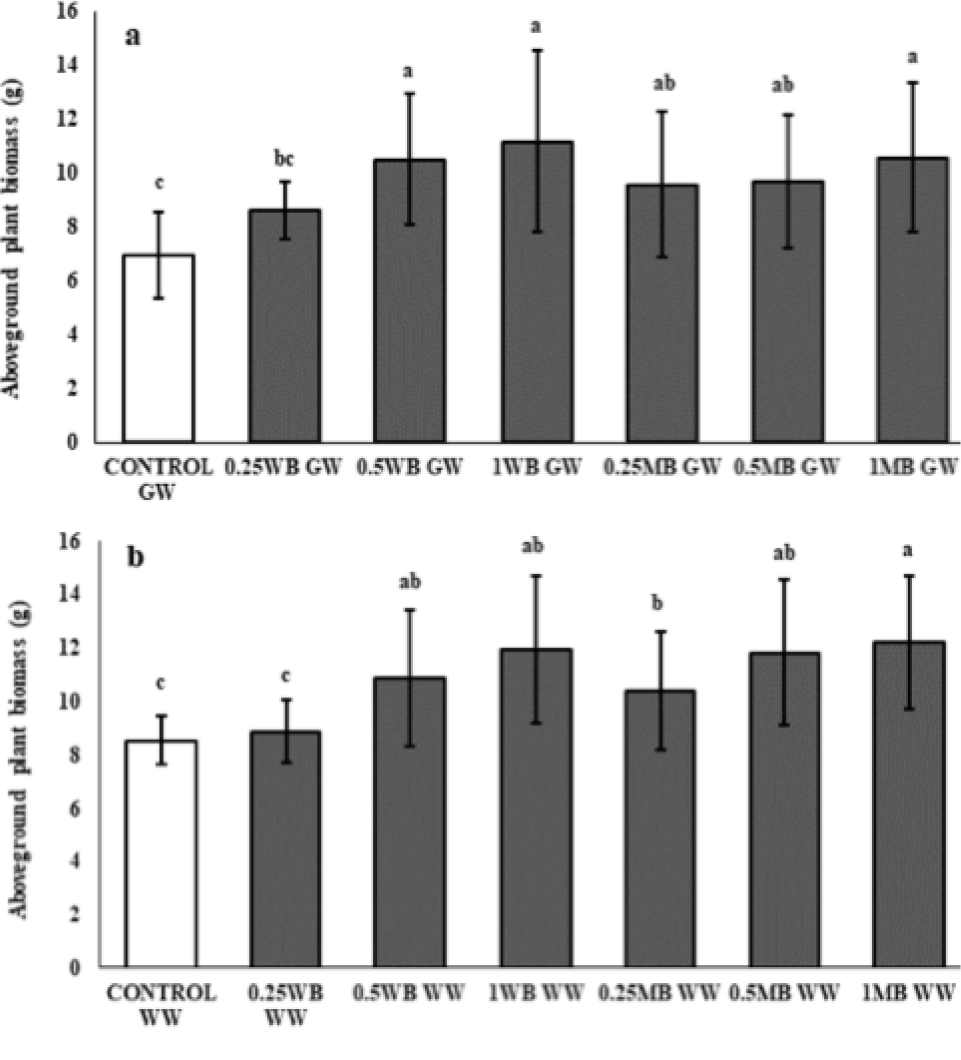
Figure 4
Mean ± SD of aboveground plant biomass (n = 15; five plants per plot) of B. rapa grown under groundwater (a) and wastewater (b) treatments. Bars with different letters represent significant difference at P<0.05 (n = 15; 5 plants per plot). GW-groundwater, WW-wastewater, WB-wood-derived biochar, MB-manure-derived biochar, 0.25-application rate of biochar as 0.25 kg m-2, 0.5-application rate of biochar as 0.5 kg m-2, 1-application rate of biochar as 1 kg m-2.
