Figure 2
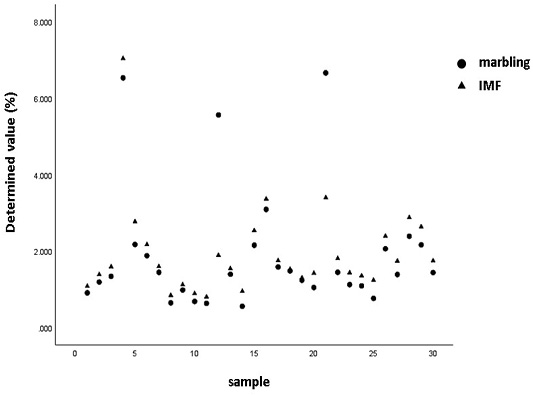
Scatterplot of intramuscular fat (IMF; depicted as triangle) and marbling percentage (depicted as dots) in the analyzed samples (Holstein: samples 1-4, 12, 18, 20, 21; Greek Red: 5-7, 26-30; Crossbreds: 8-11, 13-17, 22-25).
Scatterplot of intramuscular fat (IMF; depicted as triangle) and marbling percentage (depicted as dots) in the analyzed samples (Holstein: samples 1-4, 12, 18, 20, 21; Greek Red: 5-7, 26-30; Crossbreds: 8-11, 13-17, 22-25).