
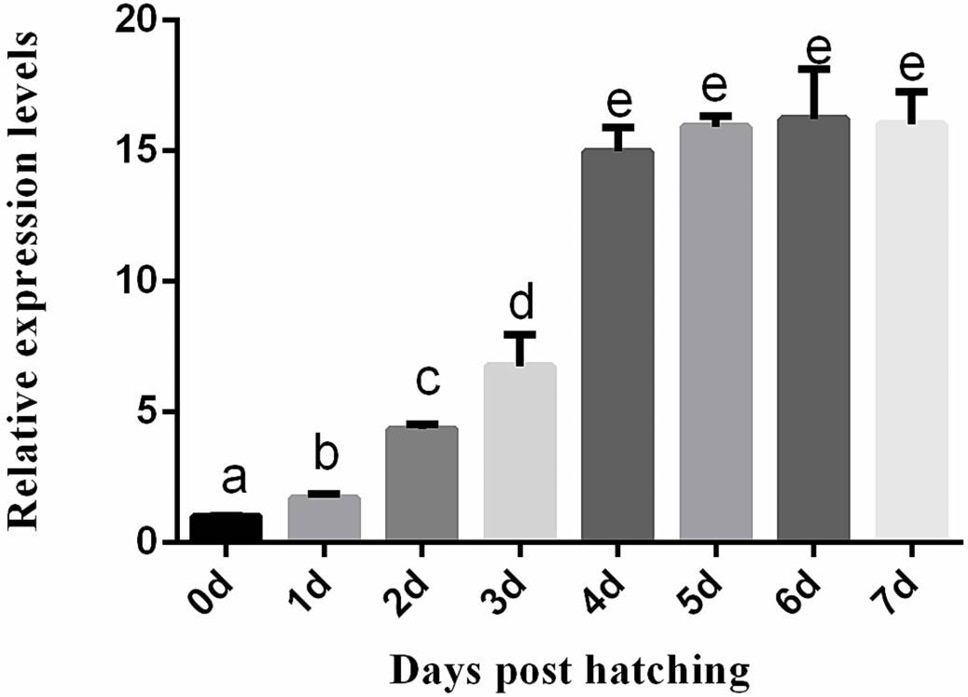
Fig. 5.
Relative expressions of L-FABP was detected by quantitative RT-PCR analysis after 0d, 1d, 2d, 3d, 4d, 5d, 6d and 7 day post hatching. Each Bar represent the mean ± SD (n=3). Different lowercase letters indicate statistically significant differences (P<0.05).