Fig 2
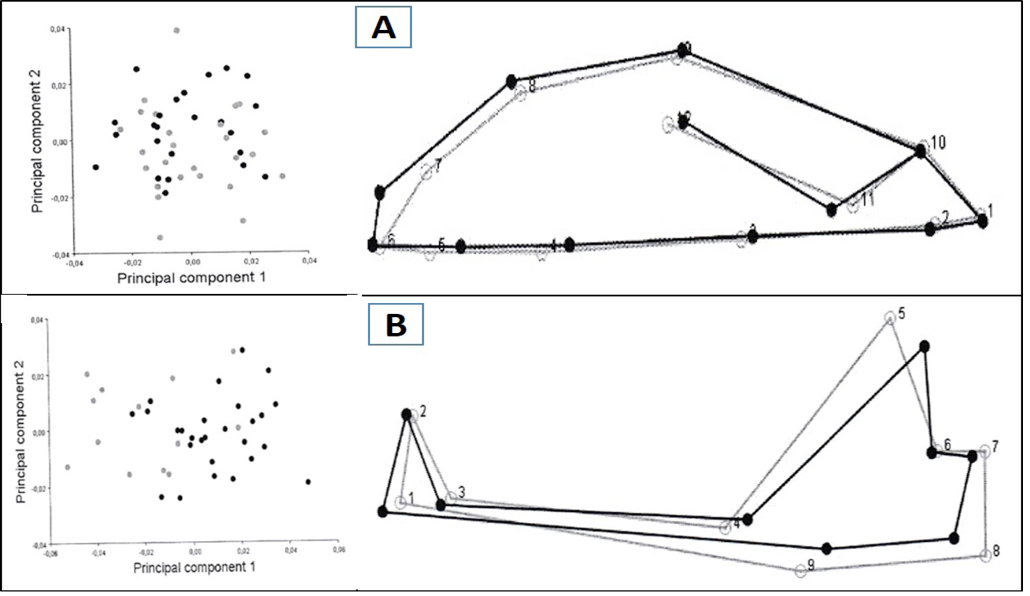
Scatter plots of the first two principal components (PC1 and PC2) of the specimens separated by sex. A, Skulls in dorsal view; B, Lateral view of mandibles. Symbols: black circles, females; grey circles, males.
Scatter plots of the first two principal components (PC1 and PC2) of the specimens separated by sex. A, Skulls in dorsal view; B, Lateral view of mandibles. Symbols: black circles, females; grey circles, males.