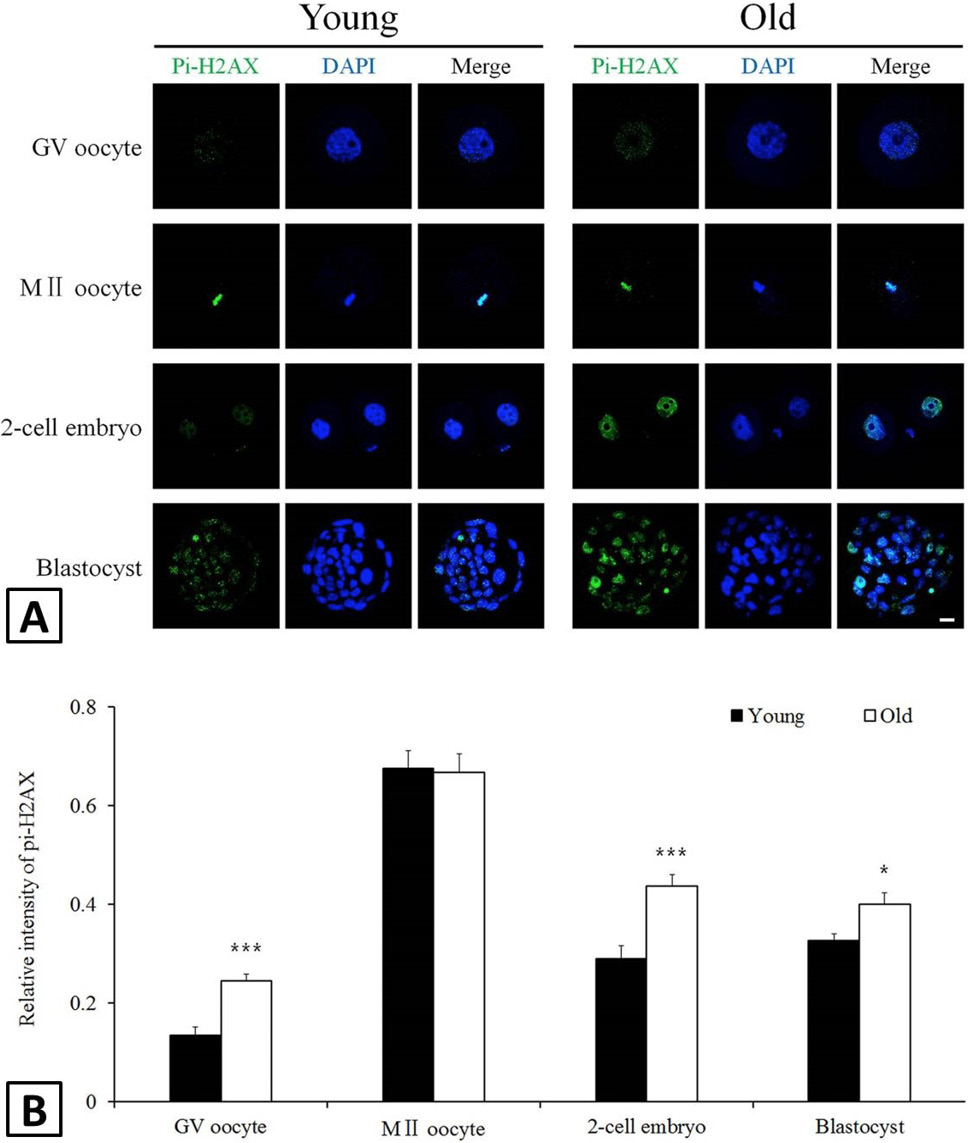
Fig. 4.
Immunofluorescent staining of DNA DSBs in oocytes and early embryos. A, representative images of oocytes and early embryos stained with pi-H2AX antibody (green) and DAPI (blue). Scale bar = 20 μm. B, relative intensities of pi-H2AX signals normalized against DNA signals. At least 25 oocytes or early embryos were analysed at each stage per group.