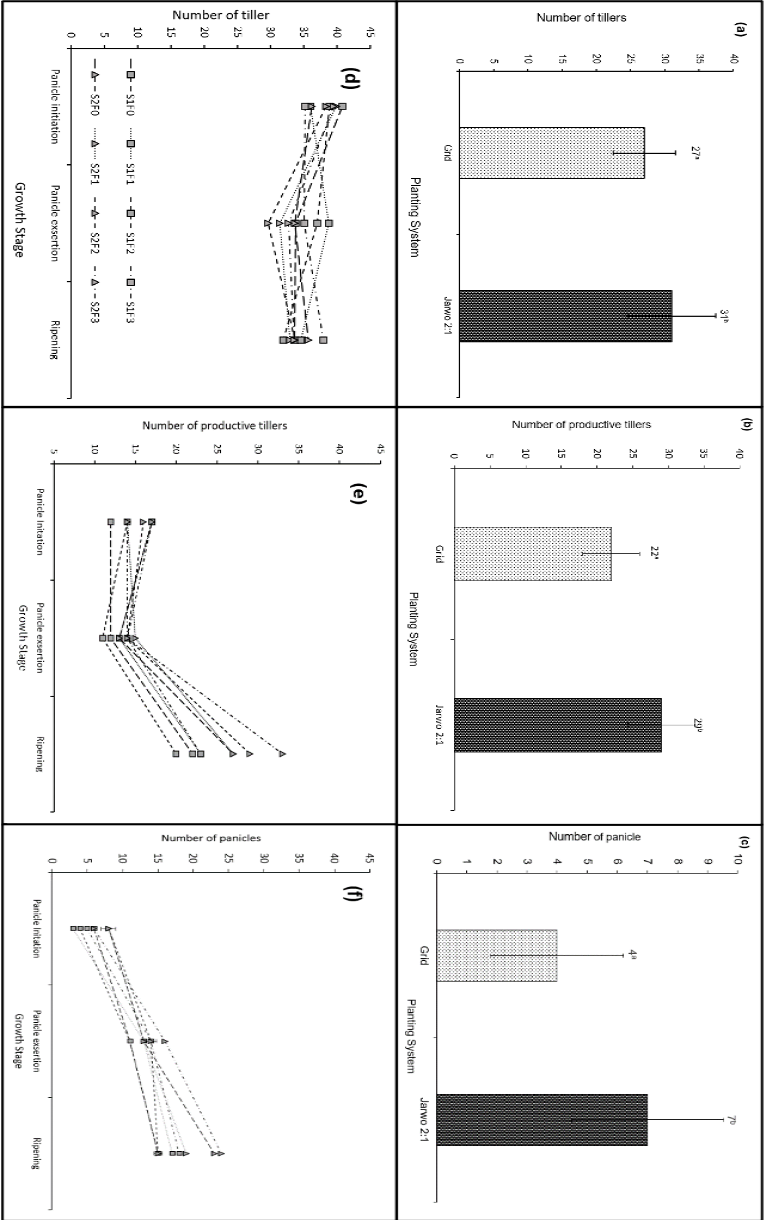
Figure 7:
Number of tillers (a), productive tillers (b), and panicle (c) affected by different cropping pattsystems. The dynamics of the number of tillers (d), productive tillers (e), and panicle (f) as affected by cropping systems and organic fertilizer doses. Error bars represent standard deviation.
