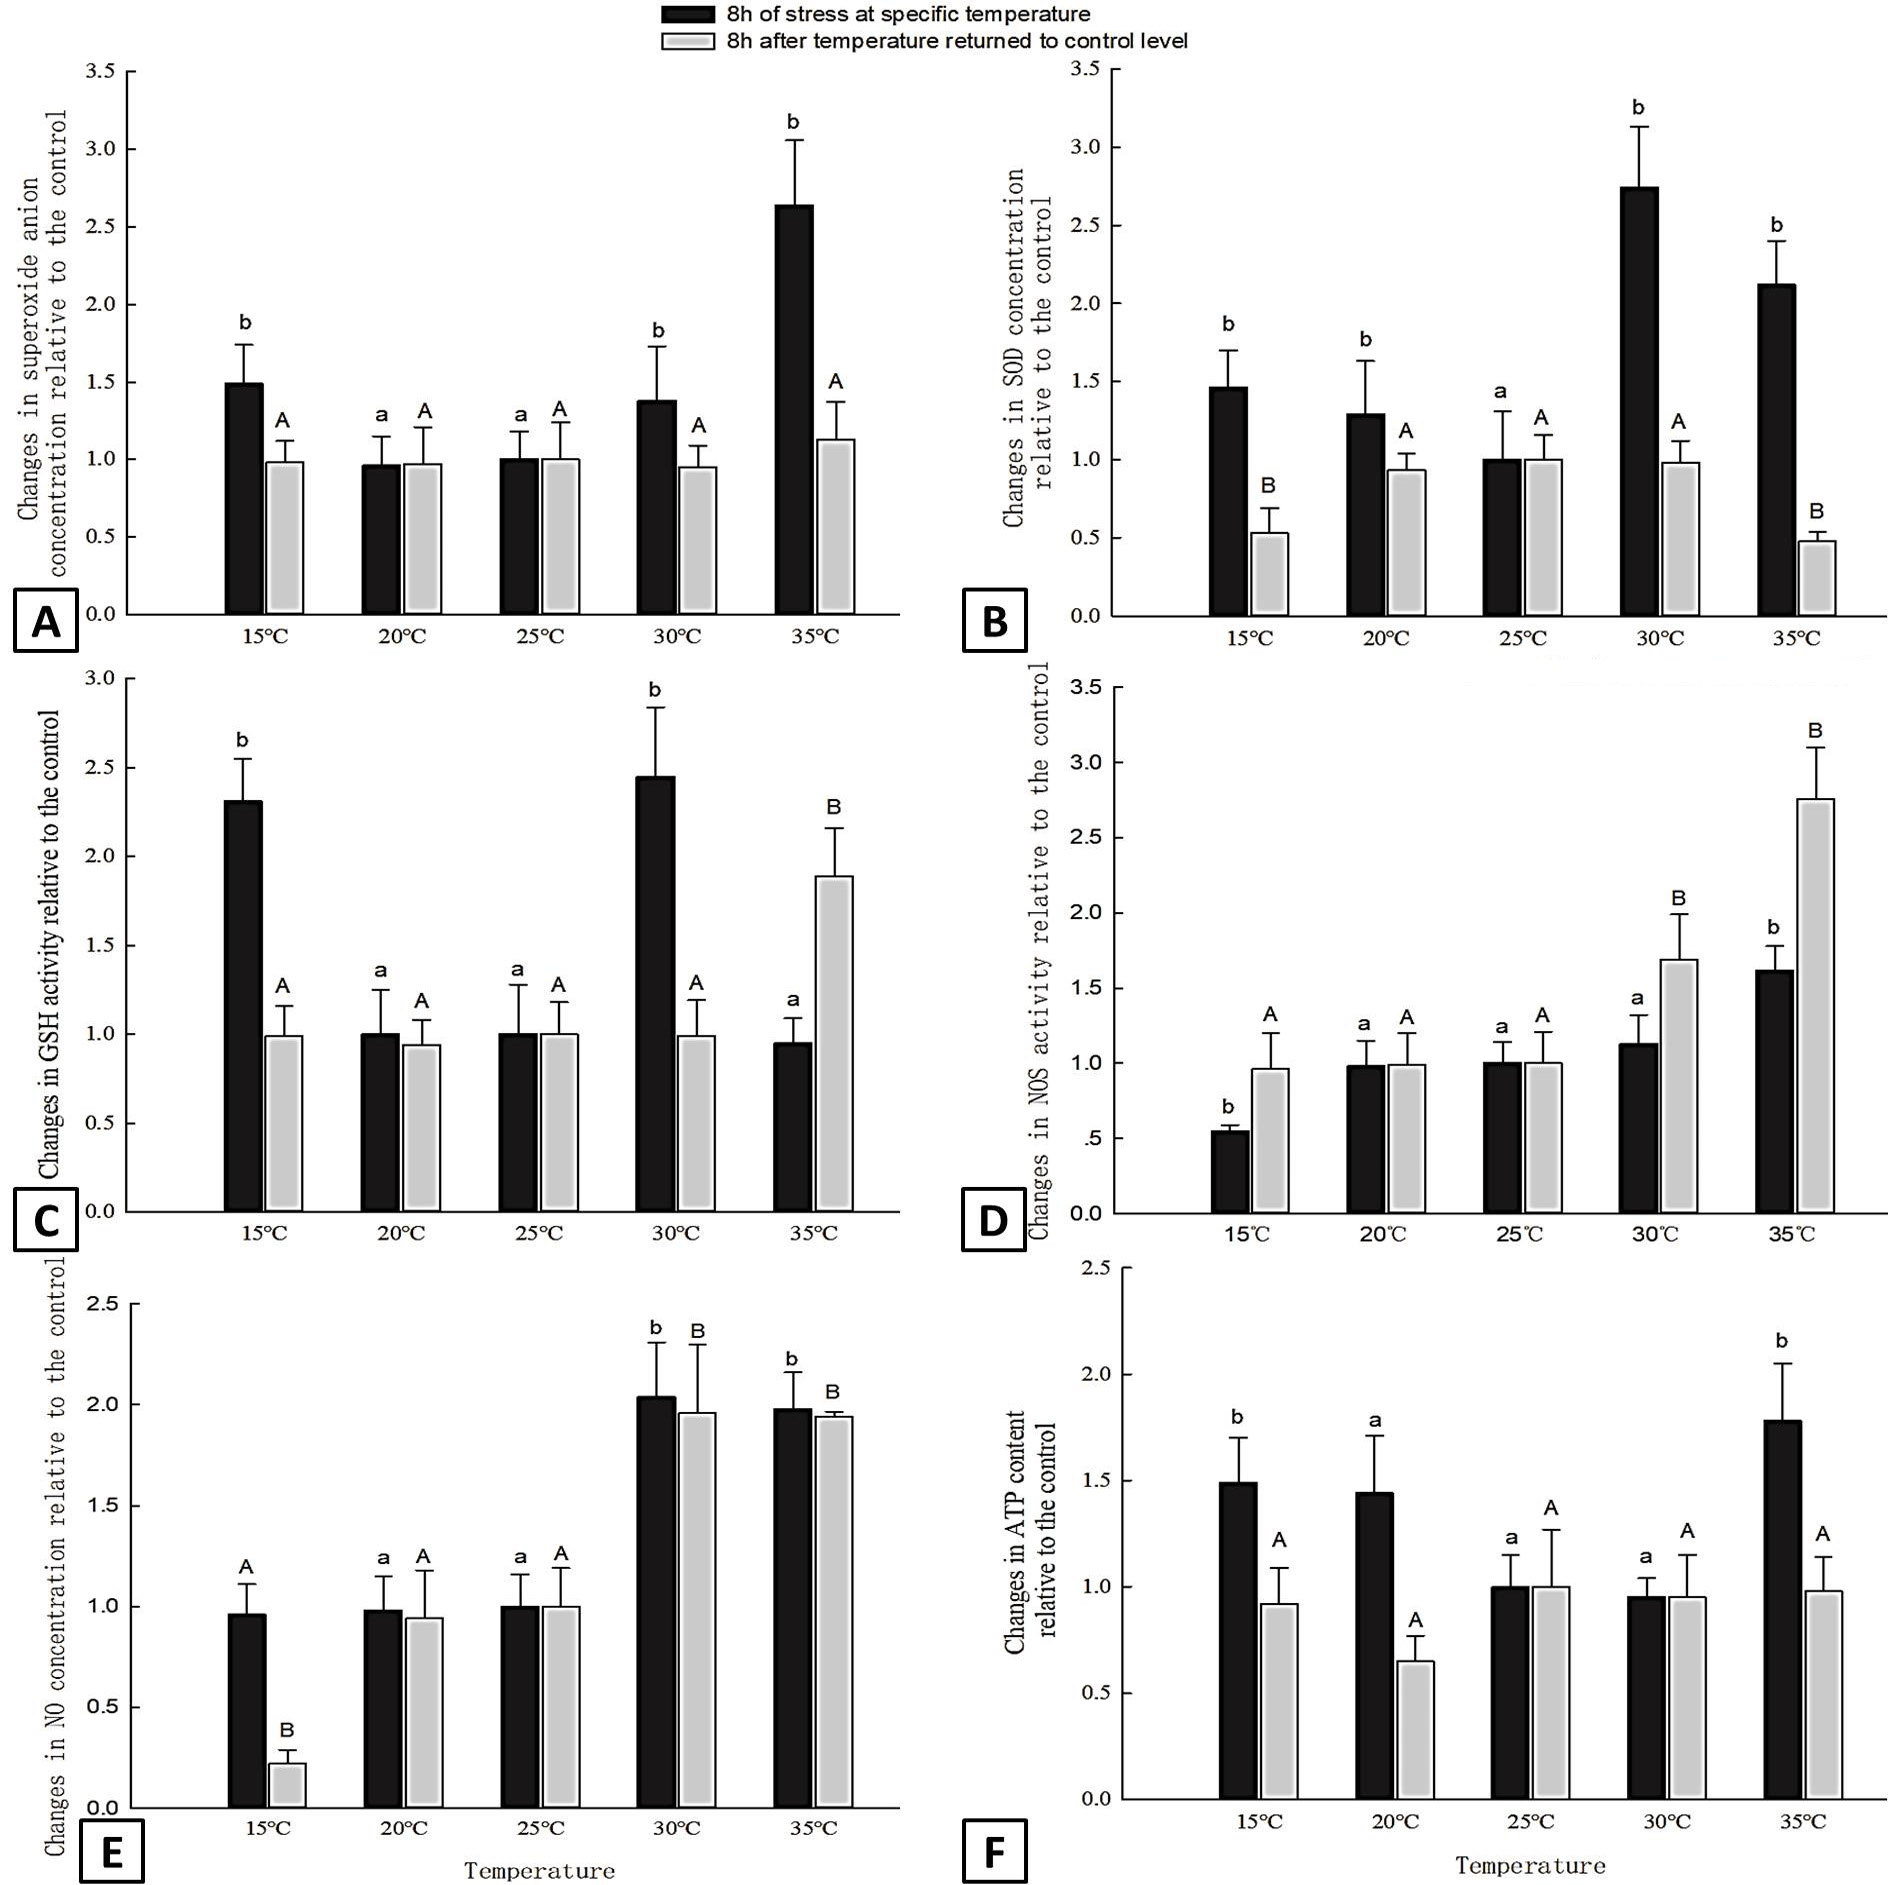
Fig. 1.
Effects of different temperatures on O2- (A), SOD (B), GSH (C), NOS (D), NO (E) and ATP content (F) in the hepatopancreas of P. monodon. Different letters within each bar indicate significant differences (P < 0.05). Data are compared in the same series.