
Fig 5
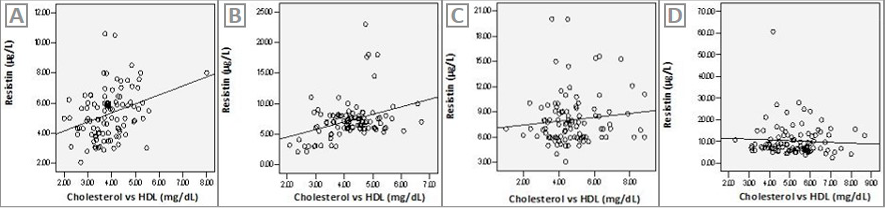
Correlation between resistin (µg/L) and cholesterol vs. HDL (mg/dL) in different BMI groups. A, normal weight group; B, overweight group; C, obese I group; D, obese II group. o, observed; ─, linear.
Correlation between resistin (µg/L) and cholesterol vs. HDL (mg/dL) in different BMI groups. A, normal weight group; B, overweight group; C, obese I group; D, obese II group. o, observed; ─, linear.