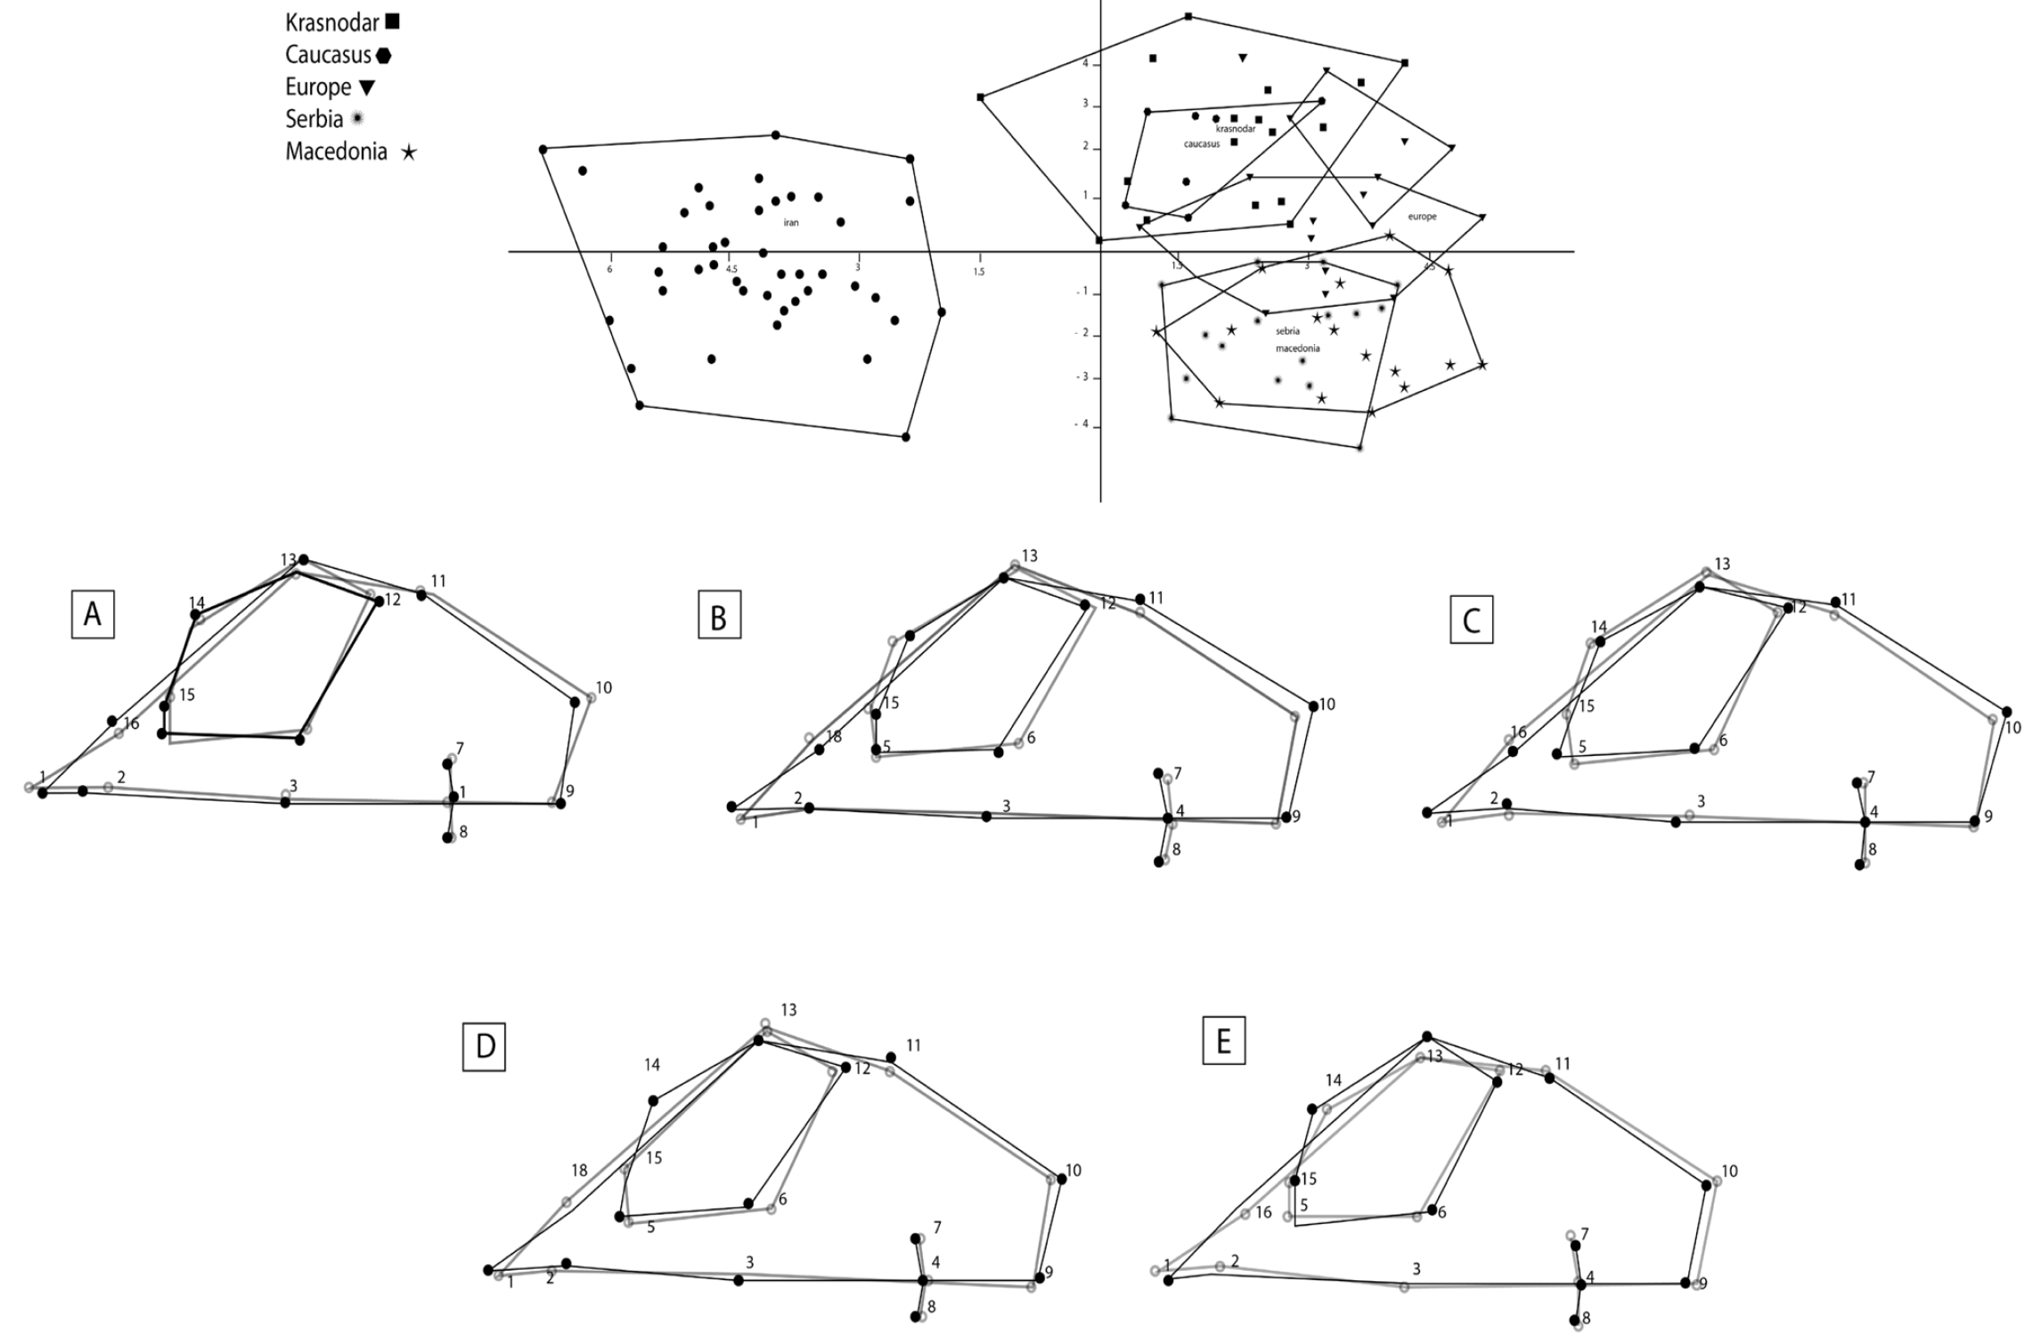
Fig. 5.
CVA analysis shows the separation of the Iranian lineage from others (two first axes justify more than 90% of variances (ventral view)). A, Iran & Caucasus; B, Iran & Krasnodar; C, Iran & Macedonia; D, Iran & Europe; E, Iran & Macedonia. Darker line shows Iranian specimens and lighter one indicates others.
