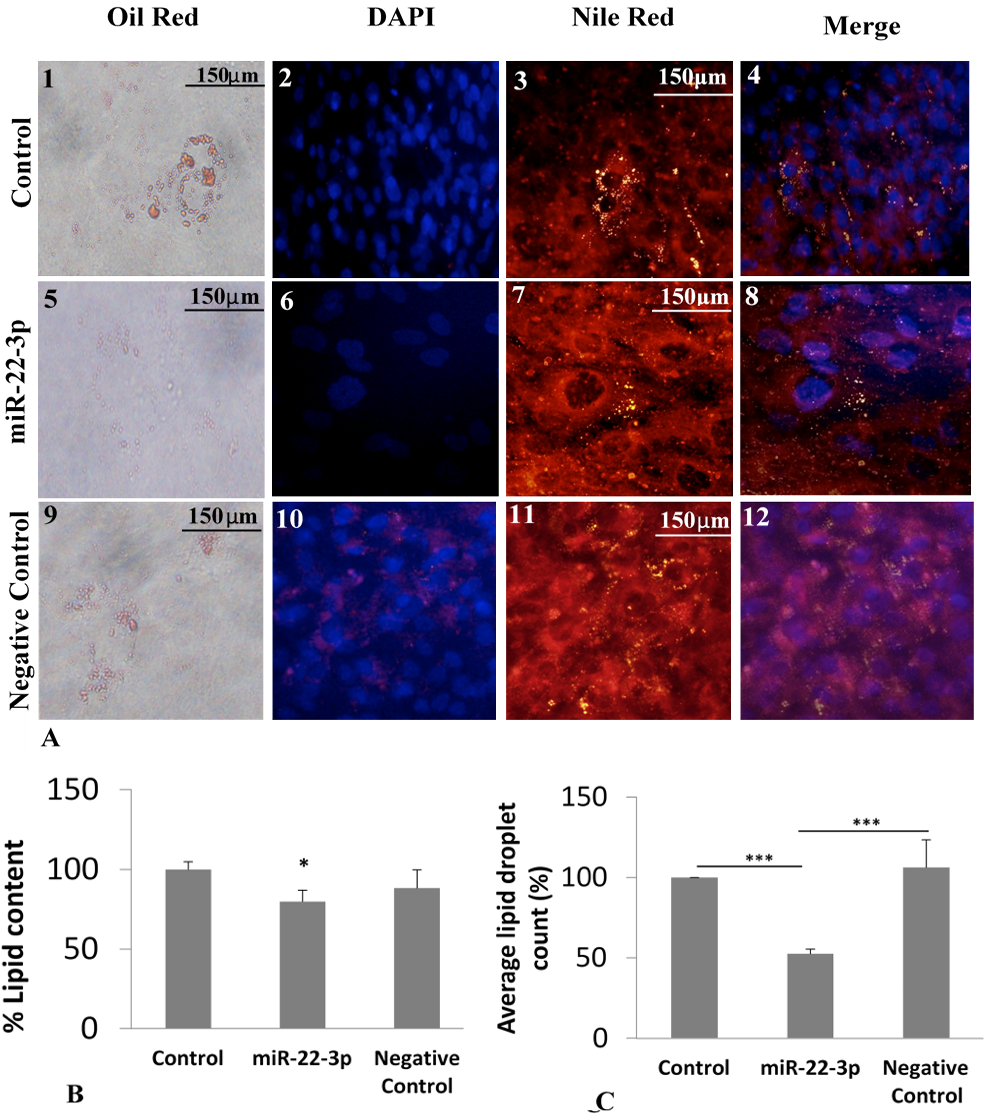
Morphological effects of miR-22-3p transfection (lipid content and lipid droplet count) on the differentiation of iMSC3 cells into adipocyte. To determine the effect of the transfection into adipocyte, Oil red, DAPI and Nile red staining were performed. A, 1-4 shows control lipid droplets in oil red and Nile red, cell nucleus in DAPI, and merged DAPI/Nile red. 5-8, miR-22-3p transfected cells and 9-11 negative control cells, respectively. B shows lipid content from iMSC3 cells differentiated into adipocytes. C shows the average number of fat droplets from different treatment groups. The experiments were performed in triplicates and the average percentage values were calculated. The data is presented as mean ± S.D. p=0.34, * p < 0.05, ** p<0.01, *** p<0.001 versus control or negative control groups.