
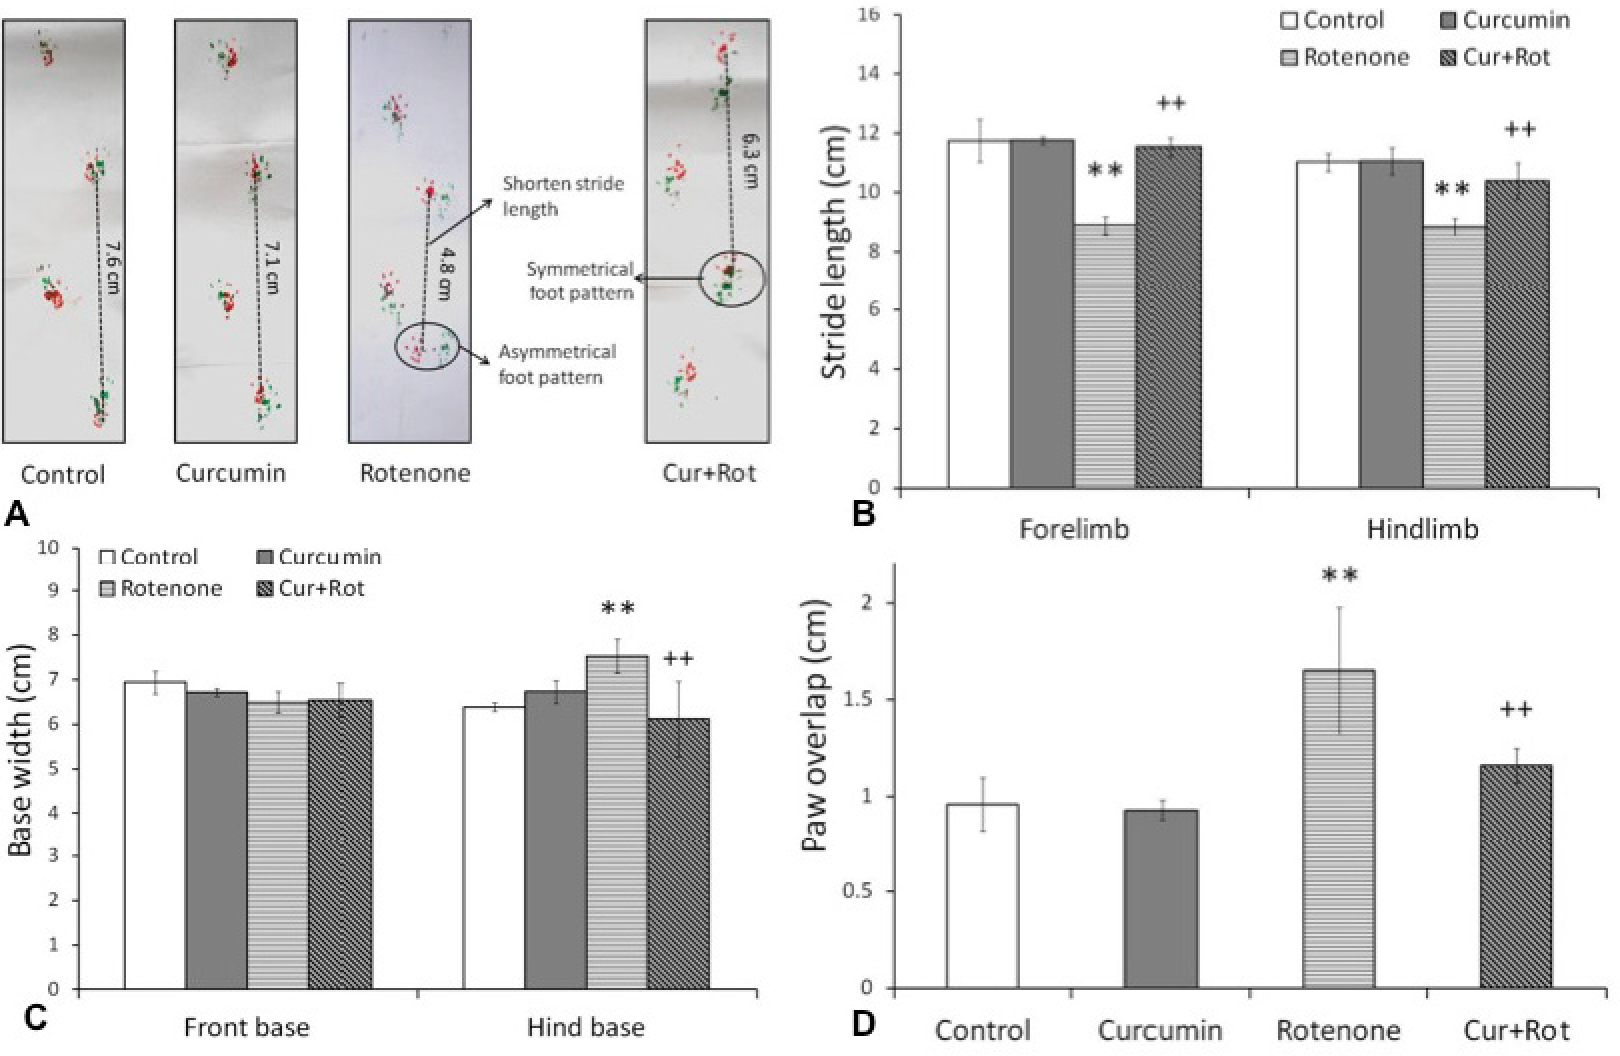
Fig. 8.
Foot pattern of rats was attained by footprint test. (A) representation of footprint pattern analysis. Forepaws and hindpaws were coated with red and green ink, respectively. The dotted lines indicate stride length. The irregular distance between the fore- and hindpaws in Rot administered rat is encircled whereas symmetrical foot pattern is encircled in Cur+Rot administered rat. The quantification of strides (B) and base width (C) in control (n=6) and test (n=6) groups. Values are mean+SD (n=6). Data was analyzed by one-way ANOVA followed by Tukey’s post-hoc test. Mean values were significantly different from controls (**p<0.01), and rotenone (n=6) injected rats (++p<0.01).