
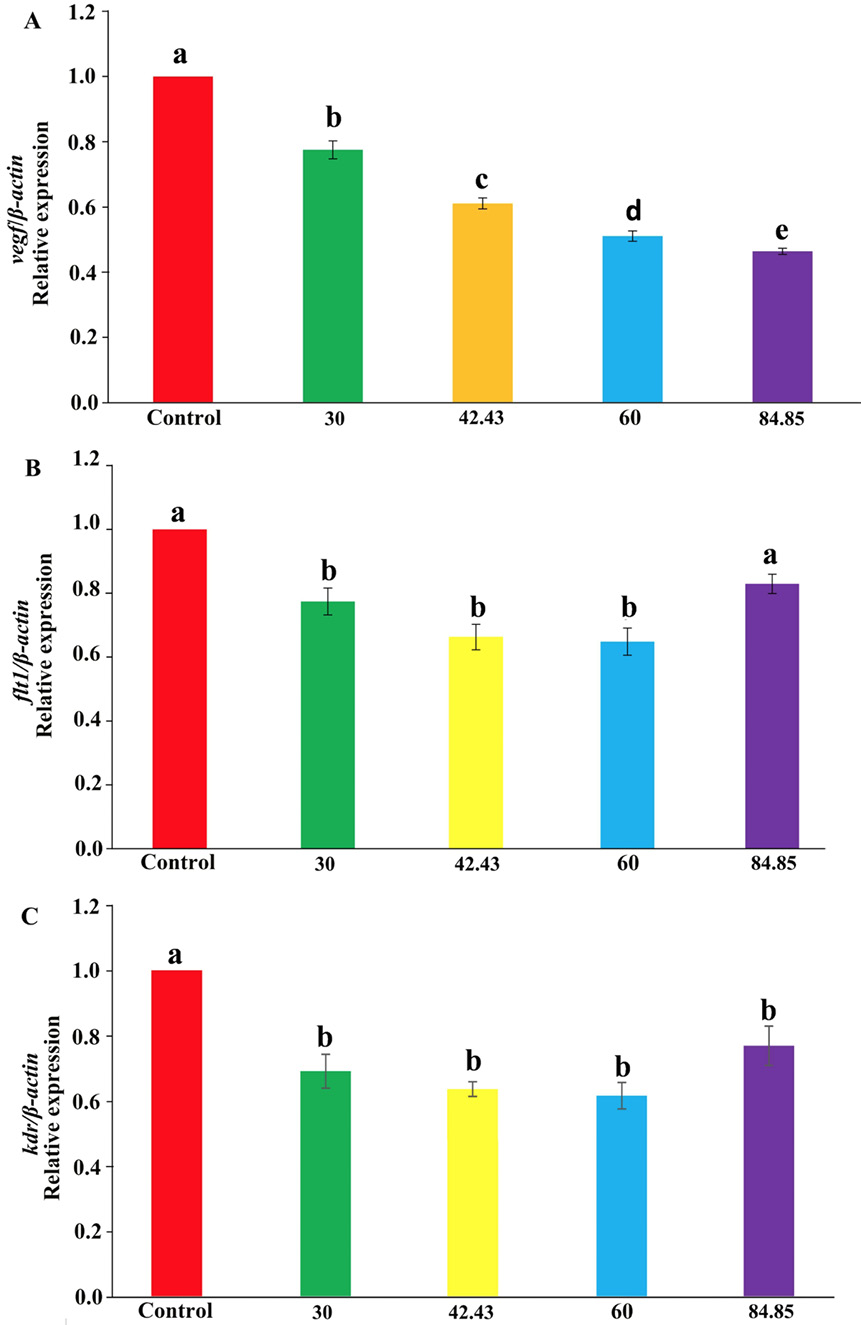
Fig. 4.
qPCR analysis of VEGF signaling pathway genes in zebrafish embryos treated with G-Rh2. qPCR analysis of vegf (A), flt1 (B) and kdr (C) mRNA expression in 72 hpf zebrafish embryos treated with different concentrations of G-Rh2 or 0.1% DMSO (vehicle control). Data are shown as mean ± SEM of triplicate experiments. Different letters (a–e) above the columns indicate significant differences (P < 0.05).